Cherokee vs Taiwanese Householder Income Ages 45 - 64 years
COMPARE
Cherokee
Taiwanese
Householder Income Ages 45 - 64 years
Householder Income Ages 45 - 64 years Comparison
Cherokee
Taiwanese
$86,125
HOUSEHOLDER INCOME AGES 45 - 64 YEARS
0.1/ 100
METRIC RATING
290th/ 347
METRIC RANK
$104,180
HOUSEHOLDER INCOME AGES 45 - 64 YEARS
87.4/ 100
METRIC RATING
136th/ 347
METRIC RANK
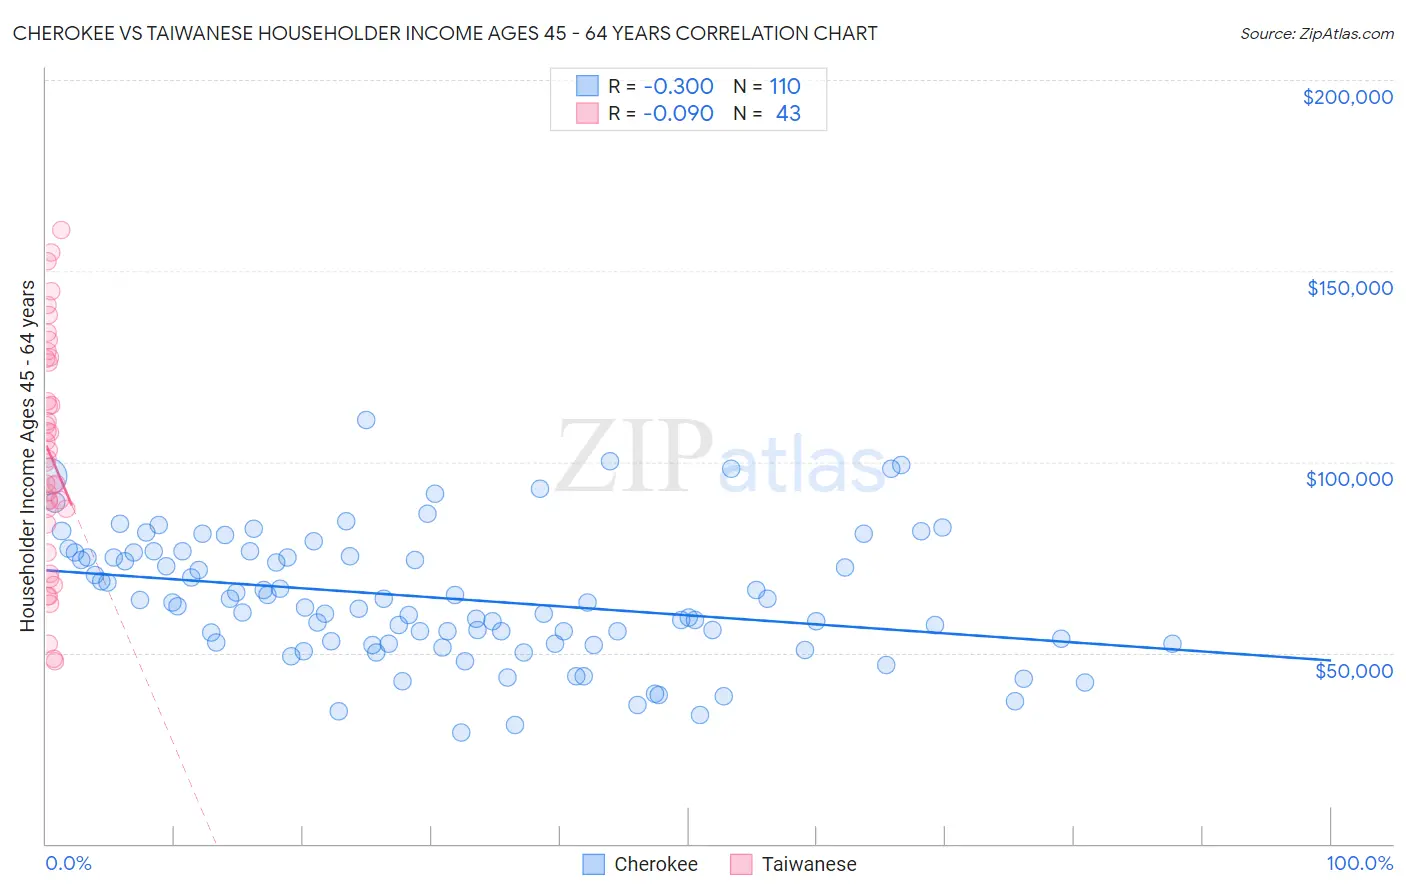
Cherokee vs Taiwanese Householder Income Ages 45 - 64 years Correlation Chart
The statistical analysis conducted on geographies consisting of 491,799,921 people shows a mild negative correlation between the proportion of Cherokee and household income with householder between the ages 45 and 64 in the United States with a correlation coefficient (R) of -0.300 and weighted average of $86,125. Similarly, the statistical analysis conducted on geographies consisting of 31,709,295 people shows a slight negative correlation between the proportion of Taiwanese and household income with householder between the ages 45 and 64 in the United States with a correlation coefficient (R) of -0.090 and weighted average of $104,180, a difference of 21.0%.
Householder Income Ages 45 - 64 years Correlation Summary
| Measurement | Cherokee | Taiwanese |
| Minimum | $29,177 | $47,813 |
| Maximum | $110,921 | $160,833 |
| Range | $81,743 | $113,020 |
| Mean | $64,277 | $102,027 |
| Median | $62,715 | $100,891 |
| Interquartile 25% (IQ1) | $52,500 | $83,846 |
| Interquartile 75% (IQ3) | $76,245 | $126,896 |
| Interquartile Range (IQR) | $23,745 | $43,050 |
| Standard Deviation (Sample) | $16,781 | $29,530 |
| Standard Deviation (Population) | $16,705 | $29,184 |
Similar Demographics by Householder Income Ages 45 - 64 years
Demographics Similar to Cherokee by Householder Income Ages 45 - 64 years
In terms of householder income ages 45 - 64 years, the demographic groups most similar to Cherokee are Hispanic or Latino ($86,006, a difference of 0.14%), Immigrants from Central America ($85,965, a difference of 0.19%), Cuban ($86,301, a difference of 0.20%), Immigrants from St. Vincent and the Grenadines ($86,394, a difference of 0.31%), and Bangladeshi ($86,402, a difference of 0.32%).
| Demographics | Rating | Rank | Householder Income Ages 45 - 64 years |
| Mexicans | 0.1 /100 | #283 | Tragic $86,816 |
| Central American Indians | 0.1 /100 | #284 | Tragic $86,764 |
| Blackfeet | 0.1 /100 | #285 | Tragic $86,595 |
| Immigrants | Guatemala | 0.1 /100 | #286 | Tragic $86,573 |
| Bangladeshis | 0.1 /100 | #287 | Tragic $86,402 |
| Immigrants | St. Vincent and the Grenadines | 0.1 /100 | #288 | Tragic $86,394 |
| Cubans | 0.1 /100 | #289 | Tragic $86,301 |
| Cherokee | 0.1 /100 | #290 | Tragic $86,125 |
| Hispanics or Latinos | 0.1 /100 | #291 | Tragic $86,006 |
| Immigrants | Central America | 0.1 /100 | #292 | Tragic $85,965 |
| Comanche | 0.1 /100 | #293 | Tragic $85,787 |
| British West Indians | 0.1 /100 | #294 | Tragic $85,571 |
| Immigrants | Grenada | 0.1 /100 | #295 | Tragic $85,552 |
| Immigrants | Zaire | 0.1 /100 | #296 | Tragic $85,207 |
| Fijians | 0.1 /100 | #297 | Tragic $85,187 |
Demographics Similar to Taiwanese by Householder Income Ages 45 - 64 years
In terms of householder income ages 45 - 64 years, the demographic groups most similar to Taiwanese are Brazilian ($104,408, a difference of 0.22%), Hungarian ($103,913, a difference of 0.26%), Canadian ($104,560, a difference of 0.36%), Arab ($104,566, a difference of 0.37%), and Ethiopian ($103,736, a difference of 0.43%).
| Demographics | Rating | Rank | Householder Income Ages 45 - 64 years |
| Peruvians | 91.5 /100 | #129 | Exceptional $105,070 |
| Immigrants | Zimbabwe | 91.2 /100 | #130 | Exceptional $104,992 |
| Immigrants | Syria | 90.7 /100 | #131 | Exceptional $104,858 |
| Lebanese | 90.1 /100 | #132 | Exceptional $104,734 |
| Arabs | 89.3 /100 | #133 | Excellent $104,566 |
| Canadians | 89.3 /100 | #134 | Excellent $104,560 |
| Brazilians | 88.6 /100 | #135 | Excellent $104,408 |
| Taiwanese | 87.4 /100 | #136 | Excellent $104,180 |
| Hungarians | 85.8 /100 | #137 | Excellent $103,913 |
| Ethiopians | 84.7 /100 | #138 | Excellent $103,736 |
| Immigrants | Oceania | 84.5 /100 | #139 | Excellent $103,705 |
| Norwegians | 84.3 /100 | #140 | Excellent $103,682 |
| Immigrants | Uganda | 83.7 /100 | #141 | Excellent $103,584 |
| Luxembourgers | 83.3 /100 | #142 | Excellent $103,536 |
| Serbians | 83.2 /100 | #143 | Excellent $103,522 |