Central American vs Immigrants from Spain Householder Income Ages 25 - 44 years
COMPARE
Central American
Immigrants from Spain
Householder Income Ages 25 - 44 years
Householder Income Ages 25 - 44 years Comparison
Central Americans
Immigrants from Spain
$85,144
HOUSEHOLDER INCOME AGES 25 - 44 YEARS
0.5/ 100
METRIC RATING
256th/ 347
METRIC RANK
$103,752
HOUSEHOLDER INCOME AGES 25 - 44 YEARS
99.4/ 100
METRIC RATING
76th/ 347
METRIC RANK
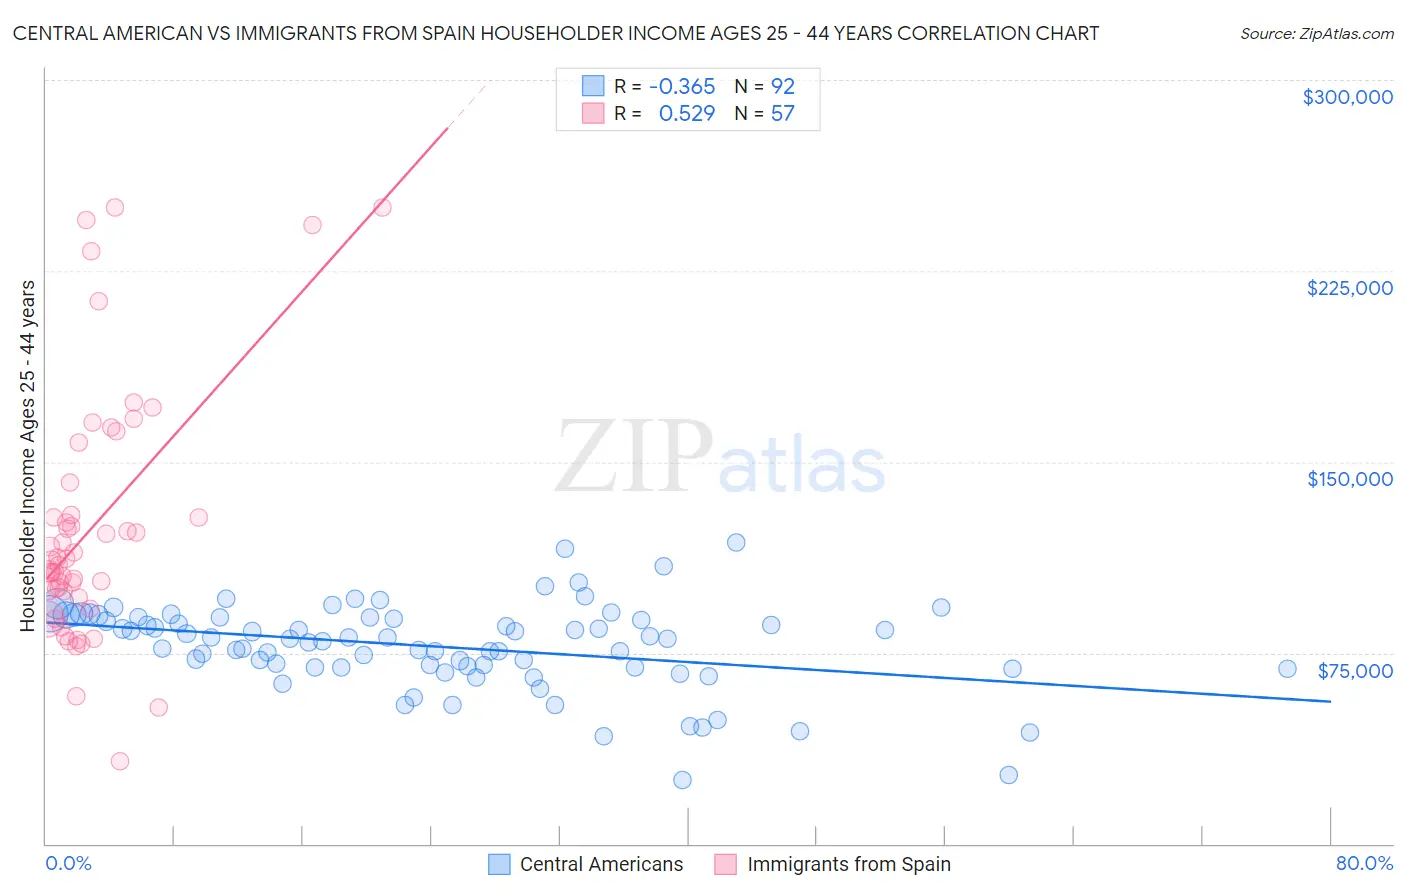
Central American vs Immigrants from Spain Householder Income Ages 25 - 44 years Correlation Chart
The statistical analysis conducted on geographies consisting of 502,385,785 people shows a mild negative correlation between the proportion of Central Americans and household income with householder between the ages 25 and 44 in the United States with a correlation coefficient (R) of -0.365 and weighted average of $85,144. Similarly, the statistical analysis conducted on geographies consisting of 239,393,463 people shows a substantial positive correlation between the proportion of Immigrants from Spain and household income with householder between the ages 25 and 44 in the United States with a correlation coefficient (R) of 0.529 and weighted average of $103,752, a difference of 21.8%.
Householder Income Ages 25 - 44 years Correlation Summary
| Measurement | Central American | Immigrants from Spain |
| Minimum | $25,224 | $32,176 |
| Maximum | $118,125 | $250,001 |
| Range | $92,901 | $217,825 |
| Mean | $77,483 | $124,125 |
| Median | $80,487 | $111,426 |
| Interquartile 25% (IQ1) | $69,364 | $97,925 |
| Interquartile 75% (IQ3) | $88,864 | $135,552 |
| Interquartile Range (IQR) | $19,500 | $37,627 |
| Standard Deviation (Sample) | $16,910 | $49,117 |
| Standard Deviation (Population) | $16,818 | $48,684 |
Similar Demographics by Householder Income Ages 25 - 44 years
Demographics Similar to Central Americans by Householder Income Ages 25 - 44 years
In terms of householder income ages 25 - 44 years, the demographic groups most similar to Central Americans are German Russian ($85,220, a difference of 0.090%), Mexican American Indian ($85,066, a difference of 0.090%), Immigrants from Nicaragua ($84,914, a difference of 0.27%), Immigrants from Senegal ($84,848, a difference of 0.35%), and American ($84,791, a difference of 0.42%).
| Demographics | Rating | Rank | Householder Income Ages 25 - 44 years |
| French American Indians | 0.8 /100 | #249 | Tragic $85,899 |
| Pennsylvania Germans | 0.8 /100 | #250 | Tragic $85,836 |
| Cape Verdeans | 0.8 /100 | #251 | Tragic $85,758 |
| Immigrants | Western Africa | 0.7 /100 | #252 | Tragic $85,676 |
| British West Indians | 0.7 /100 | #253 | Tragic $85,565 |
| Immigrants | Laos | 0.7 /100 | #254 | Tragic $85,553 |
| German Russians | 0.6 /100 | #255 | Tragic $85,220 |
| Central Americans | 0.5 /100 | #256 | Tragic $85,144 |
| Mexican American Indians | 0.5 /100 | #257 | Tragic $85,066 |
| Immigrants | Nicaragua | 0.5 /100 | #258 | Tragic $84,914 |
| Immigrants | Senegal | 0.5 /100 | #259 | Tragic $84,848 |
| Americans | 0.4 /100 | #260 | Tragic $84,791 |
| Inupiat | 0.4 /100 | #261 | Tragic $84,619 |
| Cree | 0.4 /100 | #262 | Tragic $84,574 |
| Belizeans | 0.4 /100 | #263 | Tragic $84,534 |
Demographics Similar to Immigrants from Spain by Householder Income Ages 25 - 44 years
In terms of householder income ages 25 - 44 years, the demographic groups most similar to Immigrants from Spain are Korean ($103,824, a difference of 0.070%), Immigrants from Fiji ($103,954, a difference of 0.19%), Immigrants from Southern Europe ($103,486, a difference of 0.26%), Immigrants from Bulgaria ($103,423, a difference of 0.32%), and Italian ($104,215, a difference of 0.45%).
| Demographics | Rating | Rank | Householder Income Ages 25 - 44 years |
| Mongolians | 99.6 /100 | #69 | Exceptional $104,578 |
| Immigrants | Croatia | 99.6 /100 | #70 | Exceptional $104,503 |
| Afghans | 99.6 /100 | #71 | Exceptional $104,410 |
| Chinese | 99.5 /100 | #72 | Exceptional $104,264 |
| Italians | 99.5 /100 | #73 | Exceptional $104,215 |
| Immigrants | Fiji | 99.5 /100 | #74 | Exceptional $103,954 |
| Koreans | 99.4 /100 | #75 | Exceptional $103,824 |
| Immigrants | Spain | 99.4 /100 | #76 | Exceptional $103,752 |
| Immigrants | Southern Europe | 99.3 /100 | #77 | Exceptional $103,486 |
| Immigrants | Bulgaria | 99.3 /100 | #78 | Exceptional $103,423 |
| Armenians | 99.2 /100 | #79 | Exceptional $103,248 |
| Immigrants | Egypt | 99.2 /100 | #80 | Exceptional $103,192 |
| South Africans | 99.2 /100 | #81 | Exceptional $103,160 |
| Immigrants | Serbia | 99.2 /100 | #82 | Exceptional $103,155 |
| Argentineans | 99.1 /100 | #83 | Exceptional $103,111 |