Central American vs Pennsylvania German Median Earnings
COMPARE
Central American
Pennsylvania German
Median Earnings
Median Earnings Comparison
Central Americans
Pennsylvania Germans
$42,280
MEDIAN EARNINGS
0.3/ 100
METRIC RATING
277th/ 347
METRIC RANK
$42,615
MEDIAN EARNINGS
0.5/ 100
METRIC RATING
271st/ 347
METRIC RANK
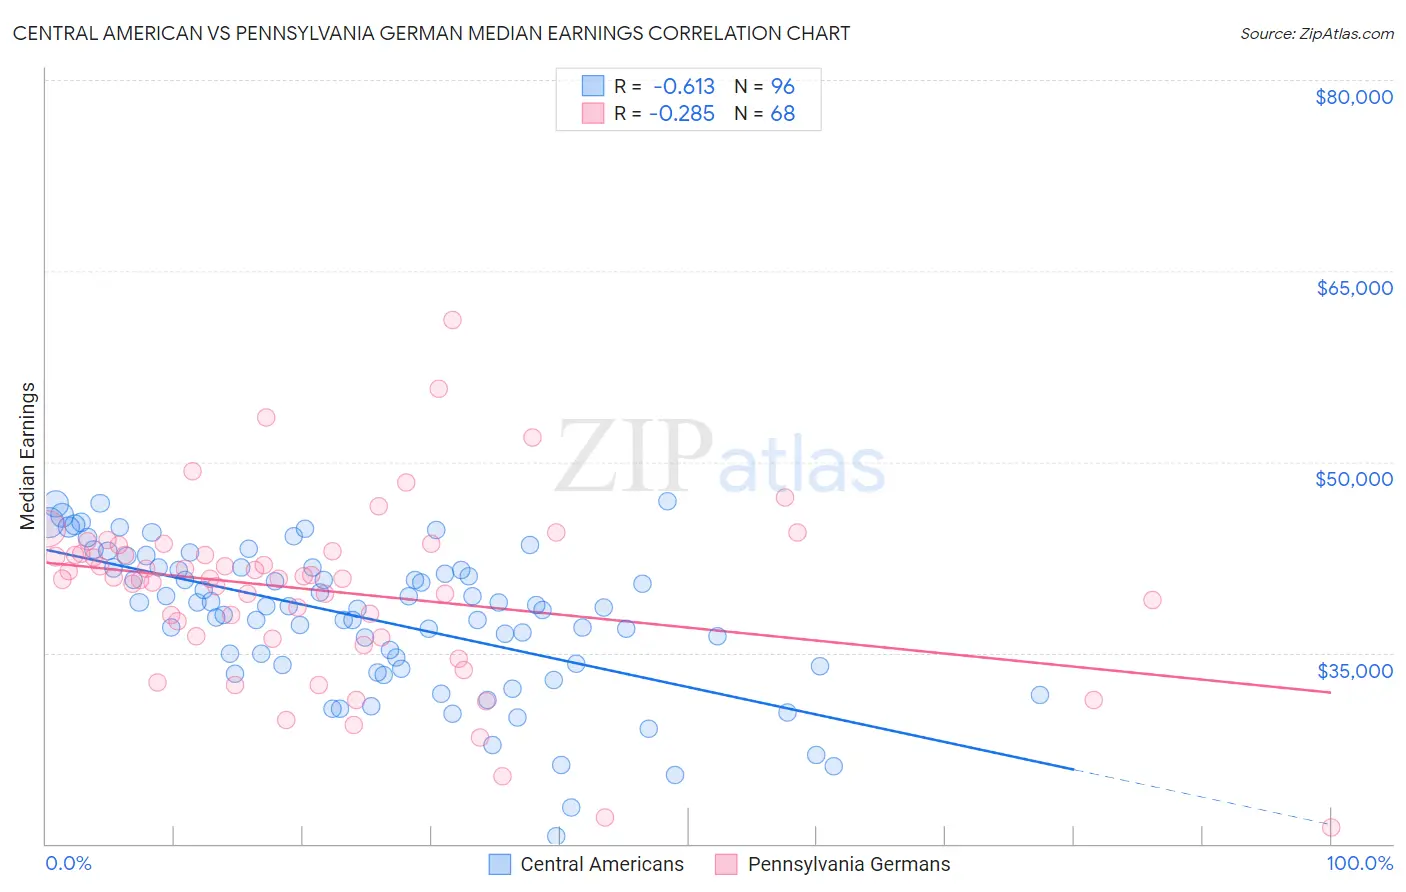
Central American vs Pennsylvania German Median Earnings Correlation Chart
The statistical analysis conducted on geographies consisting of 504,567,370 people shows a significant negative correlation between the proportion of Central Americans and median earnings in the United States with a correlation coefficient (R) of -0.613 and weighted average of $42,280. Similarly, the statistical analysis conducted on geographies consisting of 234,087,071 people shows a weak negative correlation between the proportion of Pennsylvania Germans and median earnings in the United States with a correlation coefficient (R) of -0.285 and weighted average of $42,615, a difference of 0.79%.
Median Earnings Correlation Summary
| Measurement | Central American | Pennsylvania German |
| Minimum | $20,583 | $21,250 |
| Maximum | $46,875 | $61,146 |
| Range | $26,292 | $39,896 |
| Mean | $37,665 | $39,881 |
| Median | $38,592 | $40,836 |
| Interquartile 25% (IQ1) | $34,004 | $36,214 |
| Interquartile 75% (IQ3) | $41,685 | $42,893 |
| Interquartile Range (IQR) | $7,681 | $6,679 |
| Standard Deviation (Sample) | $5,685 | $6,983 |
| Standard Deviation (Population) | $5,655 | $6,932 |
Demographics Similar to Central Americans and Pennsylvania Germans by Median Earnings
In terms of median earnings, the demographic groups most similar to Central Americans are Spanish American ($42,316, a difference of 0.090%), Immigrants from Belize ($42,339, a difference of 0.14%), Cajun ($42,189, a difference of 0.21%), Colville ($42,151, a difference of 0.31%), and Immigrants from El Salvador ($42,413, a difference of 0.32%). Similarly, the demographic groups most similar to Pennsylvania Germans are Osage ($42,651, a difference of 0.090%), Belizean ($42,702, a difference of 0.21%), American ($42,742, a difference of 0.30%), Cree ($42,777, a difference of 0.38%), and Iroquois ($42,430, a difference of 0.43%).
| Demographics | Rating | Rank | Median Earnings |
| Immigrants | Liberia | 0.7 /100 | #264 | Tragic $42,923 |
| Salvadorans | 0.7 /100 | #265 | Tragic $42,912 |
| Immigrants | Laos | 0.7 /100 | #266 | Tragic $42,884 |
| Cree | 0.6 /100 | #267 | Tragic $42,777 |
| Americans | 0.6 /100 | #268 | Tragic $42,742 |
| Belizeans | 0.5 /100 | #269 | Tragic $42,702 |
| Osage | 0.5 /100 | #270 | Tragic $42,651 |
| Pennsylvania Germans | 0.5 /100 | #271 | Tragic $42,615 |
| Iroquois | 0.4 /100 | #272 | Tragic $42,430 |
| Immigrants | Dominica | 0.4 /100 | #273 | Tragic $42,420 |
| Immigrants | El Salvador | 0.4 /100 | #274 | Tragic $42,413 |
| Immigrants | Belize | 0.3 /100 | #275 | Tragic $42,339 |
| Spanish Americans | 0.3 /100 | #276 | Tragic $42,316 |
| Central Americans | 0.3 /100 | #277 | Tragic $42,280 |
| Cajuns | 0.3 /100 | #278 | Tragic $42,189 |
| Colville | 0.2 /100 | #279 | Tragic $42,151 |
| Hmong | 0.2 /100 | #280 | Tragic $42,111 |
| Marshallese | 0.2 /100 | #281 | Tragic $41,969 |
| Africans | 0.2 /100 | #282 | Tragic $41,955 |
| Dominicans | 0.2 /100 | #283 | Tragic $41,864 |
| Blackfeet | 0.2 /100 | #284 | Tragic $41,822 |