Celtic vs Austrian Householder Income Ages 25 - 44 years
COMPARE
Celtic
Austrian
Householder Income Ages 25 - 44 years
Householder Income Ages 25 - 44 years Comparison
Celtics
Austrians
$92,241
HOUSEHOLDER INCOME AGES 25 - 44 YEARS
21.6/ 100
METRIC RATING
195th/ 347
METRIC RANK
$101,842
HOUSEHOLDER INCOME AGES 25 - 44 YEARS
98.3/ 100
METRIC RATING
97th/ 347
METRIC RANK
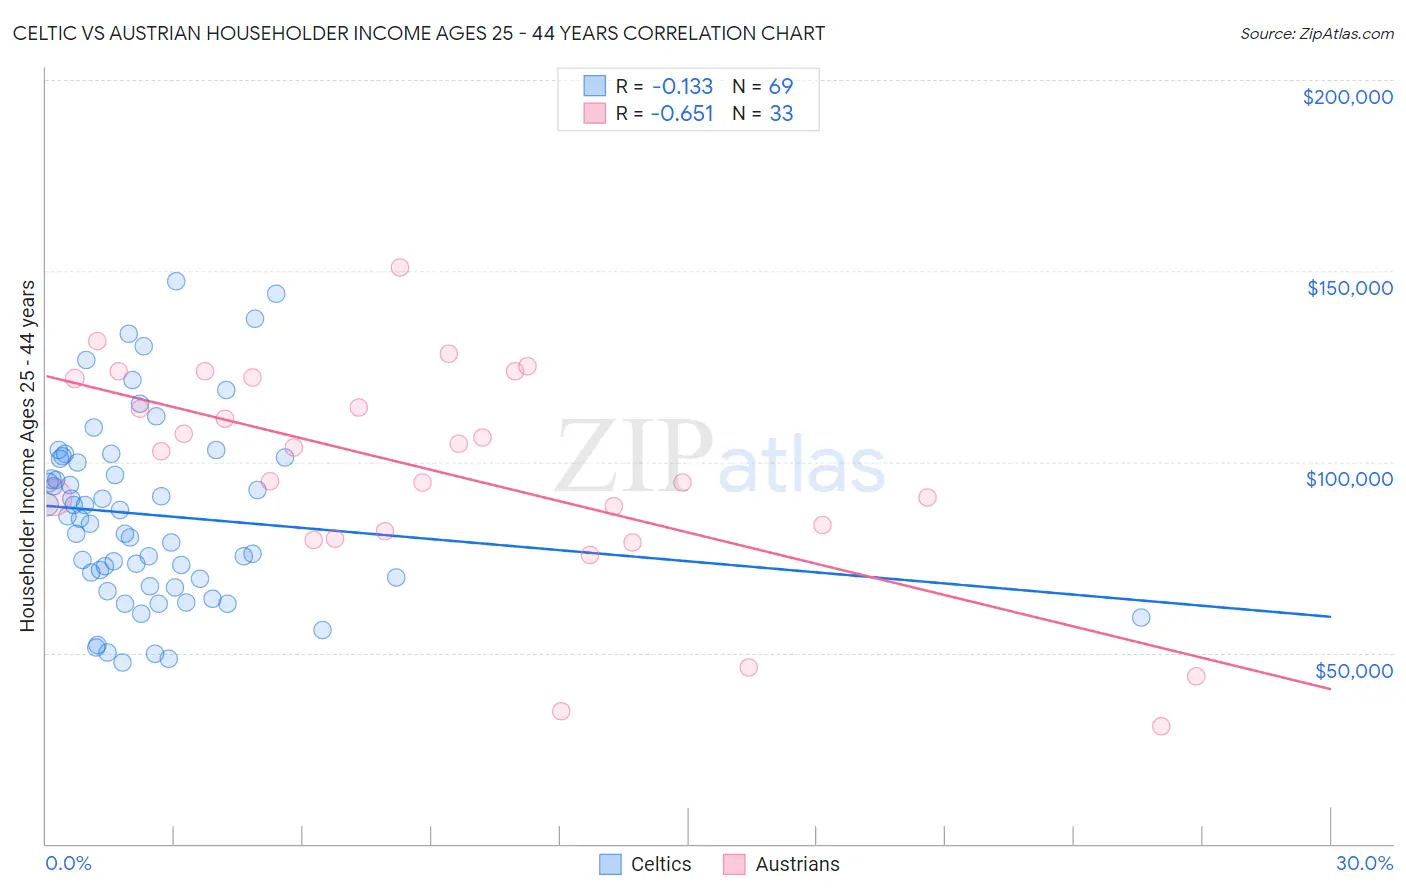
Celtic vs Austrian Householder Income Ages 25 - 44 years Correlation Chart
The statistical analysis conducted on geographies consisting of 168,638,576 people shows a poor negative correlation between the proportion of Celtics and household income with householder between the ages 25 and 44 in the United States with a correlation coefficient (R) of -0.133 and weighted average of $92,241. Similarly, the statistical analysis conducted on geographies consisting of 450,333,214 people shows a significant negative correlation between the proportion of Austrians and household income with householder between the ages 25 and 44 in the United States with a correlation coefficient (R) of -0.651 and weighted average of $101,842, a difference of 10.4%.
Householder Income Ages 25 - 44 years Correlation Summary
| Measurement | Celtic | Austrian |
| Minimum | $47,456 | $30,750 |
| Maximum | $147,258 | $150,833 |
| Range | $99,801 | $120,083 |
| Mean | $86,089 | $97,065 |
| Median | $84,960 | $102,890 |
| Interquartile 25% (IQ1) | $68,316 | $80,830 |
| Interquartile 75% (IQ3) | $100,916 | $121,881 |
| Interquartile Range (IQR) | $32,600 | $41,051 |
| Standard Deviation (Sample) | $23,857 | $28,521 |
| Standard Deviation (Population) | $23,683 | $28,086 |
Similar Demographics by Householder Income Ages 25 - 44 years
Demographics Similar to Celtics by Householder Income Ages 25 - 44 years
In terms of householder income ages 25 - 44 years, the demographic groups most similar to Celtics are Immigrants from Colombia ($92,204, a difference of 0.040%), Spanish ($92,200, a difference of 0.040%), Immigrants from the Azores ($92,322, a difference of 0.090%), Samoan ($92,385, a difference of 0.16%), and Vietnamese ($92,089, a difference of 0.16%).
| Demographics | Rating | Rank | Householder Income Ages 25 - 44 years |
| Immigrants | Sierra Leone | 30.9 /100 | #188 | Fair $93,115 |
| Dutch | 30.5 /100 | #189 | Fair $93,081 |
| Welsh | 30.0 /100 | #190 | Fair $93,039 |
| Tlingit-Haida | 29.4 /100 | #191 | Fair $92,987 |
| Immigrants | Costa Rica | 28.2 /100 | #192 | Fair $92,876 |
| Samoans | 23.0 /100 | #193 | Fair $92,385 |
| Immigrants | Azores | 22.4 /100 | #194 | Fair $92,322 |
| Celtics | 21.6 /100 | #195 | Fair $92,241 |
| Immigrants | Colombia | 21.3 /100 | #196 | Fair $92,204 |
| Spanish | 21.2 /100 | #197 | Fair $92,200 |
| Vietnamese | 20.2 /100 | #198 | Fair $92,089 |
| Kenyans | 16.8 /100 | #199 | Poor $91,684 |
| Whites/Caucasians | 16.7 /100 | #200 | Poor $91,668 |
| Japanese | 16.4 /100 | #201 | Poor $91,624 |
| Ecuadorians | 16.0 /100 | #202 | Poor $91,574 |
Demographics Similar to Austrians by Householder Income Ages 25 - 44 years
In terms of householder income ages 25 - 44 years, the demographic groups most similar to Austrians are Macedonian ($101,882, a difference of 0.040%), Assyrian/Chaldean/Syriac ($101,936, a difference of 0.090%), Immigrants from Kazakhstan ($101,727, a difference of 0.11%), Sri Lankan ($101,960, a difference of 0.12%), and Immigrants from England ($102,020, a difference of 0.17%).
| Demographics | Rating | Rank | Householder Income Ages 25 - 44 years |
| Ukrainians | 98.8 /100 | #90 | Exceptional $102,451 |
| Croatians | 98.7 /100 | #91 | Exceptional $102,414 |
| Immigrants | North America | 98.7 /100 | #92 | Exceptional $102,407 |
| Immigrants | England | 98.4 /100 | #93 | Exceptional $102,020 |
| Sri Lankans | 98.4 /100 | #94 | Exceptional $101,960 |
| Assyrians/Chaldeans/Syriacs | 98.3 /100 | #95 | Exceptional $101,936 |
| Macedonians | 98.3 /100 | #96 | Exceptional $101,882 |
| Austrians | 98.3 /100 | #97 | Exceptional $101,842 |
| Immigrants | Kazakhstan | 98.1 /100 | #98 | Exceptional $101,727 |
| Taiwanese | 97.9 /100 | #99 | Exceptional $101,492 |
| Immigrants | Argentina | 97.8 /100 | #100 | Exceptional $101,415 |
| Albanians | 97.8 /100 | #101 | Exceptional $101,367 |
| Immigrants | Lebanon | 97.4 /100 | #102 | Exceptional $101,124 |
| Immigrants | Moldova | 97.4 /100 | #103 | Exceptional $101,091 |
| Immigrants | Poland | 97.4 /100 | #104 | Exceptional $101,065 |