Celtic vs African Unemployment Among Ages 45 to 54 years
COMPARE
Celtic
African
Unemployment Among Ages 45 to 54 years
Unemployment Among Ages 45 to 54 years Comparison
Celtics
Africans
4.4%
UNEMPLOYMENT AMONG AGES 45 TO 54 YEARS
86.2/ 100
METRIC RATING
130th/ 347
METRIC RANK
5.1%
UNEMPLOYMENT AMONG AGES 45 TO 54 YEARS
0.0/ 100
METRIC RATING
282nd/ 347
METRIC RANK
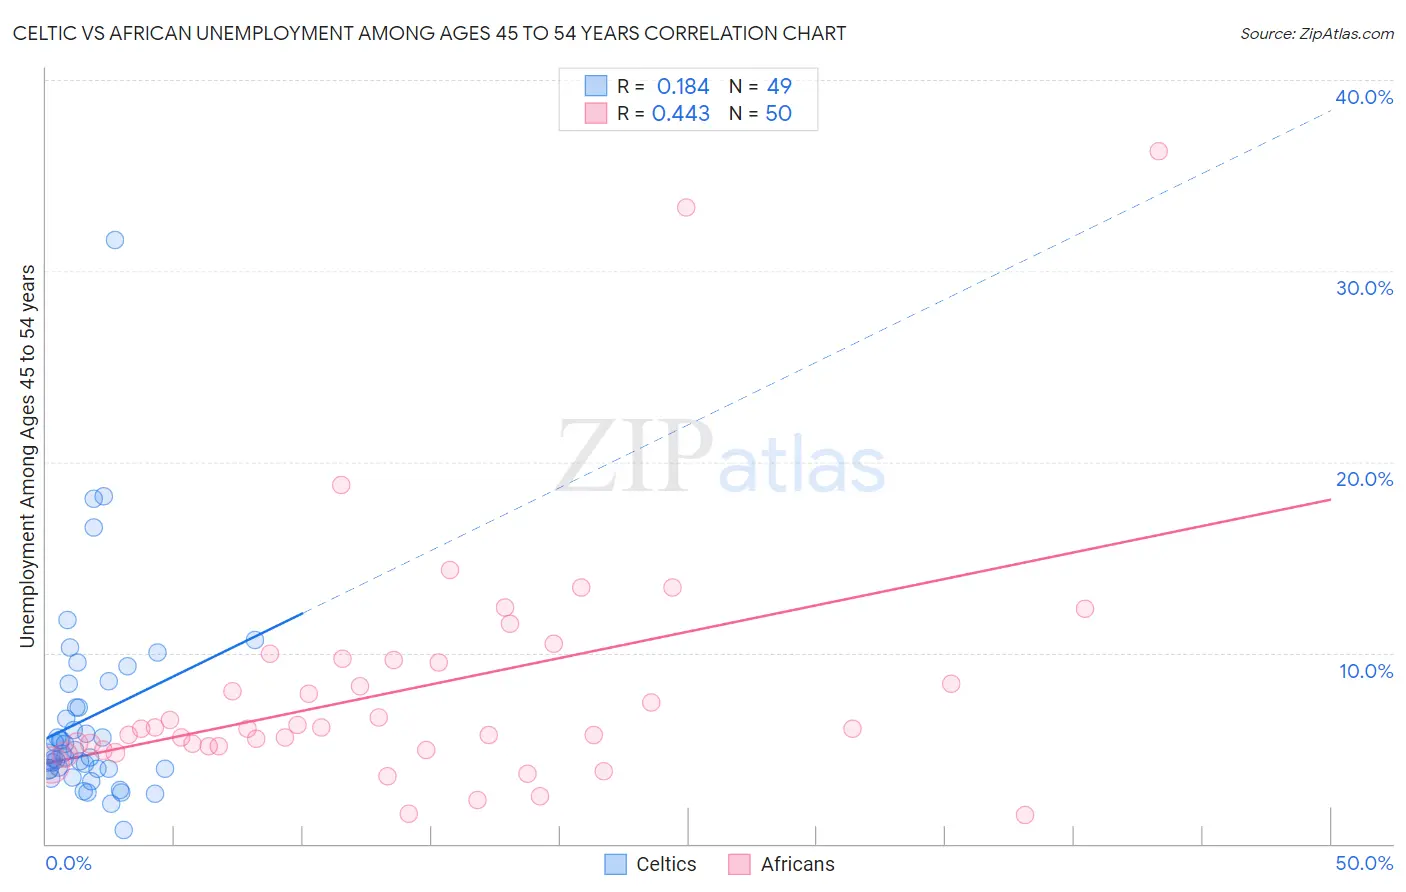
Celtic vs African Unemployment Among Ages 45 to 54 years Correlation Chart
The statistical analysis conducted on geographies consisting of 166,346,442 people shows a poor positive correlation between the proportion of Celtics and unemployment rate among population between the ages 45 and 54 in the United States with a correlation coefficient (R) of 0.184 and weighted average of 4.4%. Similarly, the statistical analysis conducted on geographies consisting of 454,220,987 people shows a moderate positive correlation between the proportion of Africans and unemployment rate among population between the ages 45 and 54 in the United States with a correlation coefficient (R) of 0.443 and weighted average of 5.1%, a difference of 14.5%.
Unemployment Among Ages 45 to 54 years Correlation Summary
| Measurement | Celtic | African |
| Minimum | 0.70% | 1.5% |
| Maximum | 31.6% | 36.3% |
| Range | 30.9% | 34.8% |
| Mean | 6.6% | 8.1% |
| Median | 4.7% | 6.0% |
| Interquartile 25% (IQ1) | 3.9% | 5.1% |
| Interquartile 75% (IQ3) | 7.8% | 9.6% |
| Interquartile Range (IQR) | 3.9% | 4.5% |
| Standard Deviation (Sample) | 5.3% | 6.5% |
| Standard Deviation (Population) | 5.2% | 6.5% |
Similar Demographics by Unemployment Among Ages 45 to 54 years
Demographics Similar to Celtics by Unemployment Among Ages 45 to 54 years
In terms of unemployment among ages 45 to 54 years, the demographic groups most similar to Celtics are Laotian (4.4%, a difference of 0.020%), Immigrants from Germany (4.4%, a difference of 0.030%), Immigrants from Northern Europe (4.4%, a difference of 0.080%), Immigrants from Eastern Africa (4.4%, a difference of 0.11%), and Immigrants from Cameroon (4.4%, a difference of 0.13%).
| Demographics | Rating | Rank | Unemployment Among Ages 45 to 54 years |
| Immigrants | Asia | 88.8 /100 | #123 | Excellent 4.4% |
| Spanish | 88.8 /100 | #124 | Excellent 4.4% |
| Immigrants | Vietnam | 88.6 /100 | #125 | Excellent 4.4% |
| Immigrants | Czechoslovakia | 87.8 /100 | #126 | Excellent 4.4% |
| Nicaraguans | 87.6 /100 | #127 | Excellent 4.4% |
| Immigrants | Northern Europe | 86.9 /100 | #128 | Excellent 4.4% |
| Laotians | 86.3 /100 | #129 | Excellent 4.4% |
| Celtics | 86.2 /100 | #130 | Excellent 4.4% |
| Immigrants | Germany | 85.9 /100 | #131 | Excellent 4.4% |
| Immigrants | Eastern Africa | 85.1 /100 | #132 | Excellent 4.4% |
| Immigrants | Cameroon | 84.8 /100 | #133 | Excellent 4.4% |
| Afghans | 84.6 /100 | #134 | Excellent 4.4% |
| Immigrants | Eastern Asia | 84.0 /100 | #135 | Excellent 4.4% |
| Immigrants | Middle Africa | 83.3 /100 | #136 | Excellent 4.4% |
| Lebanese | 81.9 /100 | #137 | Excellent 4.4% |
Demographics Similar to Africans by Unemployment Among Ages 45 to 54 years
In terms of unemployment among ages 45 to 54 years, the demographic groups most similar to Africans are Spanish American Indian (5.1%, a difference of 0.15%), Blackfeet (5.1%, a difference of 0.23%), Hispanic or Latino (5.1%, a difference of 0.41%), Nepalese (5.0%, a difference of 0.44%), and Dutch West Indian (5.0%, a difference of 0.57%).
| Demographics | Rating | Rank | Unemployment Among Ages 45 to 54 years |
| Bermudans | 0.0 /100 | #275 | Tragic 5.0% |
| French American Indians | 0.0 /100 | #276 | Tragic 5.0% |
| Immigrants | Mexico | 0.0 /100 | #277 | Tragic 5.0% |
| Dutch West Indians | 0.0 /100 | #278 | Tragic 5.0% |
| Nepalese | 0.0 /100 | #279 | Tragic 5.0% |
| Blackfeet | 0.0 /100 | #280 | Tragic 5.1% |
| Spanish American Indians | 0.0 /100 | #281 | Tragic 5.1% |
| Africans | 0.0 /100 | #282 | Tragic 5.1% |
| Hispanics or Latinos | 0.0 /100 | #283 | Tragic 5.1% |
| Kiowa | 0.0 /100 | #284 | Tragic 5.1% |
| Iroquois | 0.0 /100 | #285 | Tragic 5.1% |
| Senegalese | 0.0 /100 | #286 | Tragic 5.1% |
| Haitians | 0.0 /100 | #287 | Tragic 5.2% |
| Immigrants | Caribbean | 0.0 /100 | #288 | Tragic 5.2% |
| Immigrants | Haiti | 0.0 /100 | #289 | Tragic 5.2% |