Immigrants from Romania vs Immigrants from Argentina Householder Income Ages 45 - 64 years
COMPARE
Immigrants from Romania
Immigrants from Argentina
Householder Income Ages 45 - 64 years
Householder Income Ages 45 - 64 years Comparison
Immigrants from Romania
Immigrants from Argentina
$110,633
HOUSEHOLDER INCOME AGES 45 - 64 YEARS
99.4/ 100
METRIC RATING
68th/ 347
METRIC RANK
$108,264
HOUSEHOLDER INCOME AGES 45 - 64 YEARS
98.2/ 100
METRIC RATING
96th/ 347
METRIC RANK
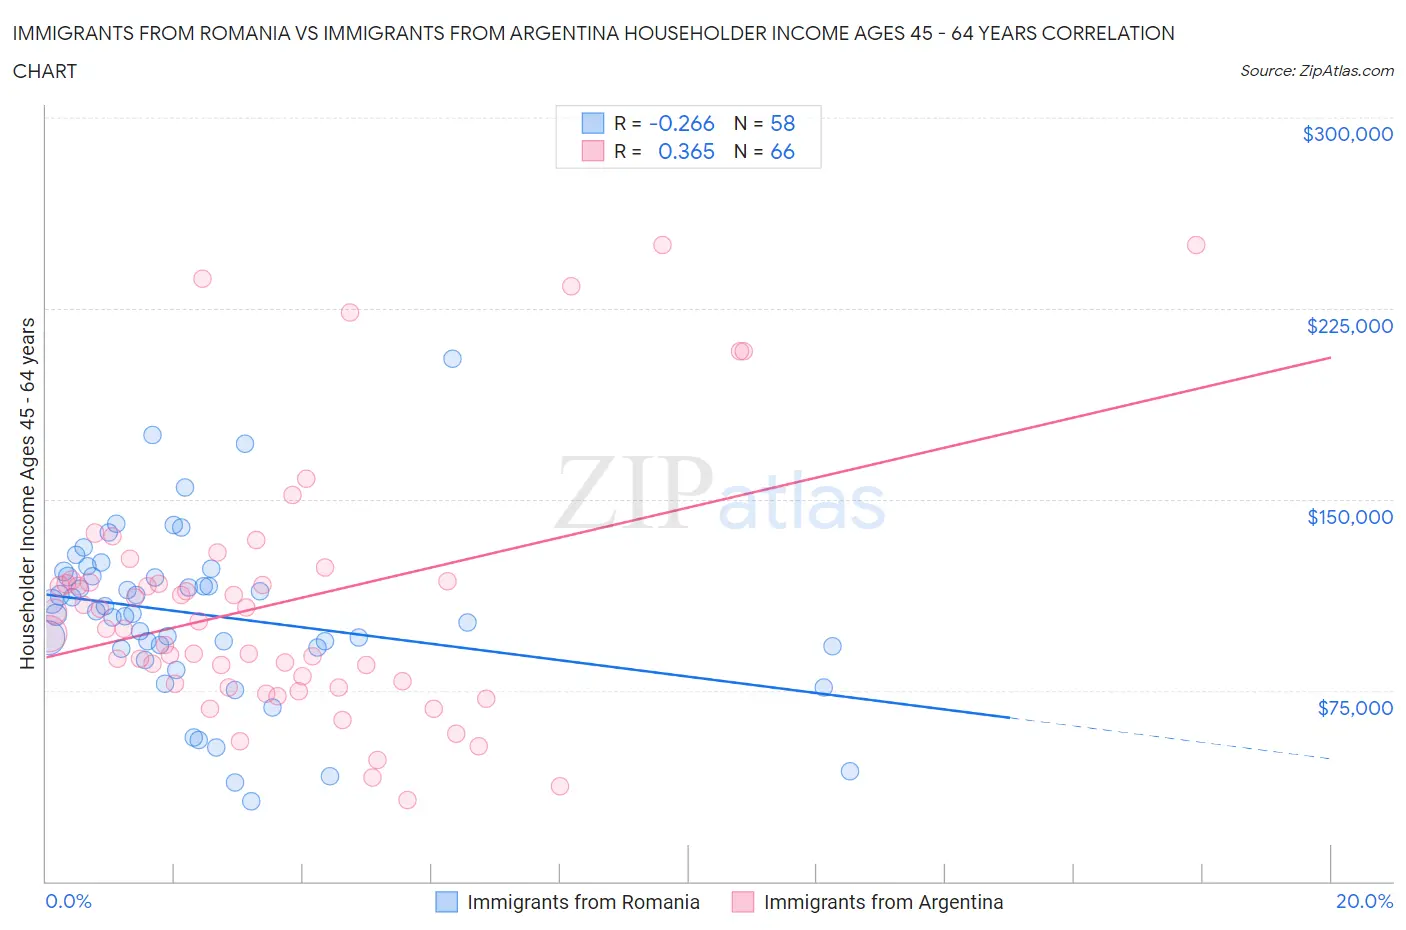
Immigrants from Romania vs Immigrants from Argentina Householder Income Ages 45 - 64 years Correlation Chart
The statistical analysis conducted on geographies consisting of 256,866,242 people shows a weak negative correlation between the proportion of Immigrants from Romania and household income with householder between the ages 45 and 64 in the United States with a correlation coefficient (R) of -0.266 and weighted average of $110,633. Similarly, the statistical analysis conducted on geographies consisting of 264,240,865 people shows a mild positive correlation between the proportion of Immigrants from Argentina and household income with householder between the ages 45 and 64 in the United States with a correlation coefficient (R) of 0.365 and weighted average of $108,264, a difference of 2.2%.
Householder Income Ages 45 - 64 years Correlation Summary
| Measurement | Immigrants from Romania | Immigrants from Argentina |
| Minimum | $31,250 | $31,738 |
| Maximum | $205,179 | $250,001 |
| Range | $173,929 | $218,263 |
| Mean | $104,590 | $109,127 |
| Median | $105,645 | $100,704 |
| Interquartile 25% (IQ1) | $91,875 | $77,665 |
| Interquartile 75% (IQ3) | $119,992 | $117,604 |
| Interquartile Range (IQR) | $28,117 | $39,939 |
| Standard Deviation (Sample) | $32,951 | $49,794 |
| Standard Deviation (Population) | $32,666 | $49,415 |
Similar Demographics by Householder Income Ages 45 - 64 years
Demographics Similar to Immigrants from Romania by Householder Income Ages 45 - 64 years
In terms of householder income ages 45 - 64 years, the demographic groups most similar to Immigrants from Romania are Immigrants from Italy ($110,434, a difference of 0.18%), Korean ($110,334, a difference of 0.27%), Italian ($110,224, a difference of 0.37%), Laotian ($111,051, a difference of 0.38%), and Assyrian/Chaldean/Syriac ($110,201, a difference of 0.39%).
| Demographics | Rating | Rank | Householder Income Ages 45 - 64 years |
| Immigrants | Czechoslovakia | 99.7 /100 | #61 | Exceptional $111,914 |
| Immigrants | Norway | 99.7 /100 | #62 | Exceptional $111,669 |
| Mongolians | 99.6 /100 | #63 | Exceptional $111,602 |
| Immigrants | Latvia | 99.6 /100 | #64 | Exceptional $111,454 |
| Immigrants | Belarus | 99.6 /100 | #65 | Exceptional $111,430 |
| New Zealanders | 99.6 /100 | #66 | Exceptional $111,286 |
| Laotians | 99.5 /100 | #67 | Exceptional $111,051 |
| Immigrants | Romania | 99.4 /100 | #68 | Exceptional $110,633 |
| Immigrants | Italy | 99.4 /100 | #69 | Exceptional $110,434 |
| Koreans | 99.3 /100 | #70 | Exceptional $110,334 |
| Italians | 99.3 /100 | #71 | Exceptional $110,224 |
| Assyrians/Chaldeans/Syriacs | 99.3 /100 | #72 | Exceptional $110,201 |
| Argentineans | 99.3 /100 | #73 | Exceptional $110,103 |
| Immigrants | Egypt | 99.2 /100 | #74 | Exceptional $109,941 |
| South Africans | 99.1 /100 | #75 | Exceptional $109,719 |
Demographics Similar to Immigrants from Argentina by Householder Income Ages 45 - 64 years
In terms of householder income ages 45 - 64 years, the demographic groups most similar to Immigrants from Argentina are Immigrants from Hungary ($108,267, a difference of 0.0%), Sri Lankan ($108,270, a difference of 0.010%), Immigrants from Croatia ($108,304, a difference of 0.040%), Croatian ($108,383, a difference of 0.11%), and Ukrainian ($108,475, a difference of 0.19%).
| Demographics | Rating | Rank | Householder Income Ages 45 - 64 years |
| Ukrainians | 98.3 /100 | #89 | Exceptional $108,475 |
| Immigrants | Philippines | 98.3 /100 | #90 | Exceptional $108,471 |
| Immigrants | Lebanon | 98.3 /100 | #91 | Exceptional $108,471 |
| Croatians | 98.3 /100 | #92 | Exceptional $108,383 |
| Immigrants | Croatia | 98.2 /100 | #93 | Exceptional $108,304 |
| Sri Lankans | 98.2 /100 | #94 | Exceptional $108,270 |
| Immigrants | Hungary | 98.2 /100 | #95 | Exceptional $108,267 |
| Immigrants | Argentina | 98.2 /100 | #96 | Exceptional $108,264 |
| Northern Europeans | 97.8 /100 | #97 | Exceptional $107,870 |
| Immigrants | Southern Europe | 97.7 /100 | #98 | Exceptional $107,775 |
| Palestinians | 97.6 /100 | #99 | Exceptional $107,721 |
| Immigrants | Serbia | 97.4 /100 | #100 | Exceptional $107,569 |
| Immigrants | Kazakhstan | 97.2 /100 | #101 | Exceptional $107,378 |
| Immigrants | Moldova | 97.1 /100 | #102 | Exceptional $107,357 |
| Syrians | 96.9 /100 | #103 | Exceptional $107,207 |