Immigrants from Russia vs Immigrants from Northern Europe Householder Income Ages 45 - 64 years
COMPARE
Immigrants from Russia
Immigrants from Northern Europe
Householder Income Ages 45 - 64 years
Householder Income Ages 45 - 64 years Comparison
Immigrants from Russia
Immigrants from Northern Europe
$113,215
HOUSEHOLDER INCOME AGES 45 - 64 YEARS
99.8/ 100
METRIC RATING
49th/ 347
METRIC RANK
$117,930
HOUSEHOLDER INCOME AGES 45 - 64 YEARS
100.0/ 100
METRIC RATING
27th/ 347
METRIC RANK
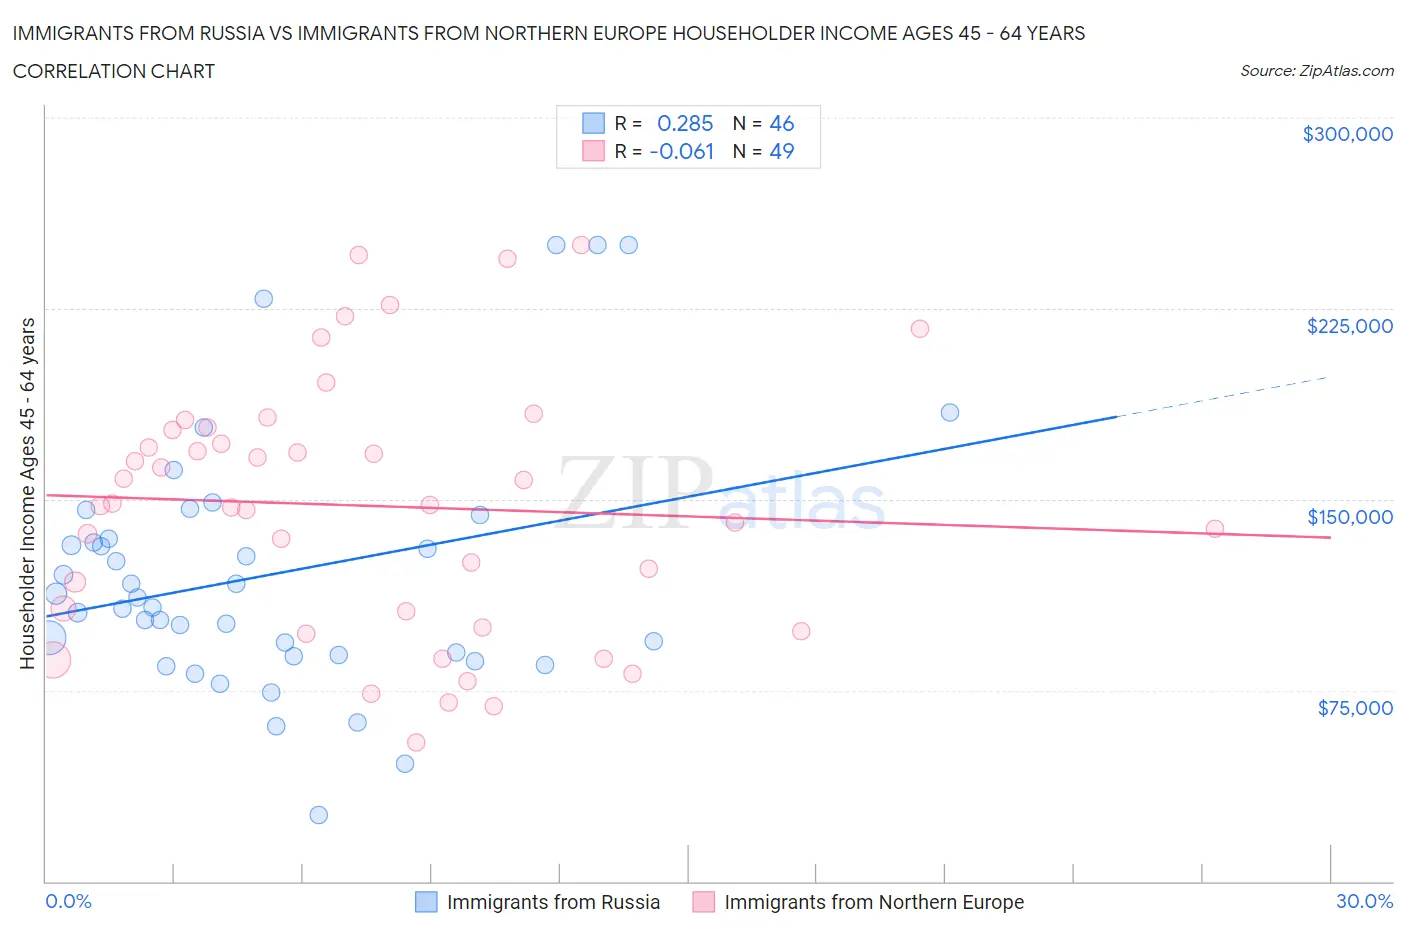
Immigrants from Russia vs Immigrants from Northern Europe Householder Income Ages 45 - 64 years Correlation Chart
The statistical analysis conducted on geographies consisting of 347,427,203 people shows a weak positive correlation between the proportion of Immigrants from Russia and household income with householder between the ages 45 and 64 in the United States with a correlation coefficient (R) of 0.285 and weighted average of $113,215. Similarly, the statistical analysis conducted on geographies consisting of 476,061,115 people shows a slight negative correlation between the proportion of Immigrants from Northern Europe and household income with householder between the ages 45 and 64 in the United States with a correlation coefficient (R) of -0.061 and weighted average of $117,930, a difference of 4.2%.
Householder Income Ages 45 - 64 years Correlation Summary
| Measurement | Immigrants from Russia | Immigrants from Northern Europe |
| Minimum | $26,250 | $54,375 |
| Maximum | $250,001 | $250,001 |
| Range | $223,751 | $195,626 |
| Mean | $120,532 | $147,439 |
| Median | $109,623 | $147,652 |
| Interquartile 25% (IQ1) | $89,063 | $102,957 |
| Interquartile 75% (IQ3) | $134,641 | $177,734 |
| Interquartile Range (IQR) | $45,578 | $74,777 |
| Standard Deviation (Sample) | $49,965 | $50,256 |
| Standard Deviation (Population) | $49,419 | $49,741 |
Similar Demographics by Householder Income Ages 45 - 64 years
Demographics Similar to Immigrants from Russia by Householder Income Ages 45 - 64 years
In terms of householder income ages 45 - 64 years, the demographic groups most similar to Immigrants from Russia are Immigrants from Austria ($113,140, a difference of 0.070%), Immigrants from Indonesia ($113,519, a difference of 0.27%), Australian ($113,533, a difference of 0.28%), Immigrants from Greece ($113,548, a difference of 0.29%), and Immigrants from South Africa ($112,886, a difference of 0.29%).
| Demographics | Rating | Rank | Householder Income Ages 45 - 64 years |
| Estonians | 99.9 /100 | #42 | Exceptional $114,220 |
| Israelis | 99.9 /100 | #43 | Exceptional $114,186 |
| Bulgarians | 99.9 /100 | #44 | Exceptional $113,883 |
| Immigrants | France | 99.9 /100 | #45 | Exceptional $113,680 |
| Immigrants | Greece | 99.9 /100 | #46 | Exceptional $113,548 |
| Australians | 99.9 /100 | #47 | Exceptional $113,533 |
| Immigrants | Indonesia | 99.9 /100 | #48 | Exceptional $113,519 |
| Immigrants | Russia | 99.8 /100 | #49 | Exceptional $113,215 |
| Immigrants | Austria | 99.8 /100 | #50 | Exceptional $113,140 |
| Immigrants | South Africa | 99.8 /100 | #51 | Exceptional $112,886 |
| Immigrants | Malaysia | 99.8 /100 | #52 | Exceptional $112,796 |
| Afghans | 99.8 /100 | #53 | Exceptional $112,676 |
| Greeks | 99.8 /100 | #54 | Exceptional $112,630 |
| Lithuanians | 99.8 /100 | #55 | Exceptional $112,484 |
| Egyptians | 99.7 /100 | #56 | Exceptional $112,256 |
Demographics Similar to Immigrants from Northern Europe by Householder Income Ages 45 - 64 years
In terms of householder income ages 45 - 64 years, the demographic groups most similar to Immigrants from Northern Europe are Turkish ($117,814, a difference of 0.10%), Bhutanese ($117,750, a difference of 0.15%), Immigrants from Bolivia ($117,731, a difference of 0.17%), Immigrants from Sweden ($118,318, a difference of 0.33%), and Asian ($118,426, a difference of 0.42%).
| Demographics | Rating | Rank | Householder Income Ages 45 - 64 years |
| Immigrants | Australia | 100.0 /100 | #20 | Exceptional $119,308 |
| Immigrants | Sri Lanka | 100.0 /100 | #21 | Exceptional $119,094 |
| Immigrants | Belgium | 100.0 /100 | #22 | Exceptional $118,932 |
| Bolivians | 100.0 /100 | #23 | Exceptional $118,871 |
| Immigrants | Japan | 100.0 /100 | #24 | Exceptional $118,498 |
| Asians | 100.0 /100 | #25 | Exceptional $118,426 |
| Immigrants | Sweden | 100.0 /100 | #26 | Exceptional $118,318 |
| Immigrants | Northern Europe | 100.0 /100 | #27 | Exceptional $117,930 |
| Turks | 100.0 /100 | #28 | Exceptional $117,814 |
| Bhutanese | 100.0 /100 | #29 | Exceptional $117,750 |
| Immigrants | Bolivia | 100.0 /100 | #30 | Exceptional $117,731 |
| Immigrants | Asia | 100.0 /100 | #31 | Exceptional $116,566 |
| Russians | 100.0 /100 | #32 | Exceptional $116,328 |
| Chinese | 100.0 /100 | #33 | Exceptional $116,156 |
| Immigrants | Denmark | 100.0 /100 | #34 | Exceptional $116,000 |