Czech vs Immigrants from Nicaragua Householder Income Over 65 years
COMPARE
Czech
Immigrants from Nicaragua
Householder Income Over 65 years
Householder Income Over 65 years Comparison
Czechs
Immigrants from Nicaragua
$61,244
HOUSEHOLDER INCOME OVER 65 YEARS
57.2/ 100
METRIC RATING
162nd/ 347
METRIC RANK
$52,085
HOUSEHOLDER INCOME OVER 65 YEARS
0.0/ 100
METRIC RATING
313th/ 347
METRIC RANK
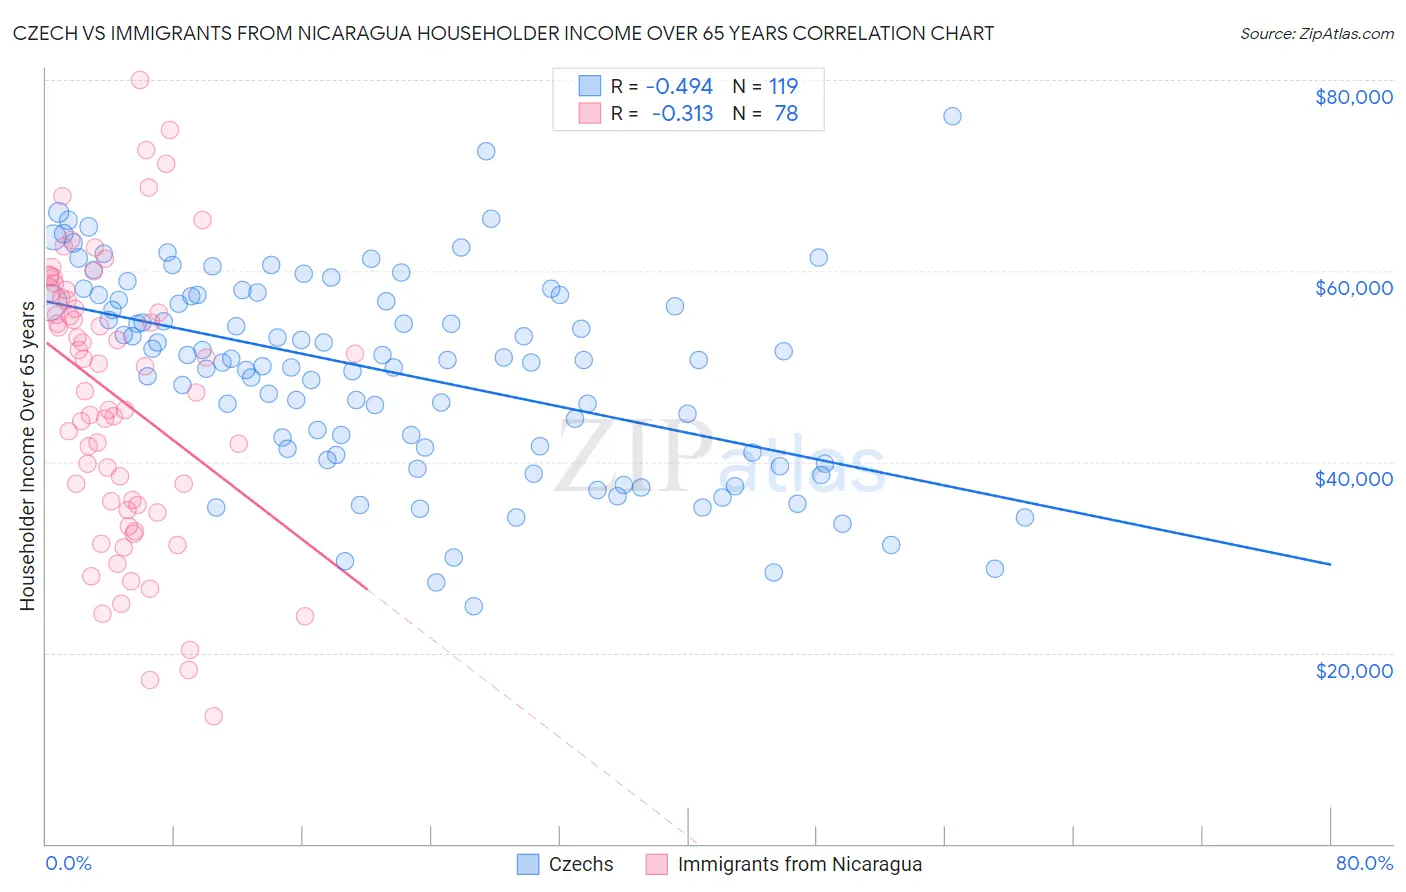
Czech vs Immigrants from Nicaragua Householder Income Over 65 years Correlation Chart
The statistical analysis conducted on geographies consisting of 482,438,211 people shows a moderate negative correlation between the proportion of Czechs and household income with householder over the age of 65 in the United States with a correlation coefficient (R) of -0.494 and weighted average of $61,244. Similarly, the statistical analysis conducted on geographies consisting of 236,036,400 people shows a mild negative correlation between the proportion of Immigrants from Nicaragua and household income with householder over the age of 65 in the United States with a correlation coefficient (R) of -0.313 and weighted average of $52,085, a difference of 17.6%.
Householder Income Over 65 years Correlation Summary
| Measurement | Czech | Immigrants from Nicaragua |
| Minimum | $24,894 | $13,371 |
| Maximum | $76,250 | $80,000 |
| Range | $51,356 | $66,629 |
| Mean | $49,506 | $46,721 |
| Median | $50,665 | $48,735 |
| Interquartile 25% (IQ1) | $41,396 | $35,431 |
| Interquartile 75% (IQ3) | $57,446 | $57,245 |
| Interquartile Range (IQR) | $16,049 | $21,814 |
| Standard Deviation (Sample) | $10,394 | $14,647 |
| Standard Deviation (Population) | $10,351 | $14,553 |
Similar Demographics by Householder Income Over 65 years
Demographics Similar to Czechs by Householder Income Over 65 years
In terms of householder income over 65 years, the demographic groups most similar to Czechs are Icelander ($61,270, a difference of 0.040%), Ugandan ($61,177, a difference of 0.11%), Immigrants from North Macedonia ($61,175, a difference of 0.11%), Immigrants from Ukraine ($61,163, a difference of 0.13%), and Immigrants from Eastern Africa ($61,157, a difference of 0.14%).
| Demographics | Rating | Rank | Householder Income Over 65 years |
| Poles | 65.9 /100 | #155 | Good $61,598 |
| Scandinavians | 65.6 /100 | #156 | Good $61,586 |
| Macedonians | 65.1 /100 | #157 | Good $61,564 |
| English | 63.3 /100 | #158 | Good $61,487 |
| Brazilians | 62.7 /100 | #159 | Good $61,465 |
| Portuguese | 62.1 /100 | #160 | Good $61,440 |
| Icelanders | 57.9 /100 | #161 | Average $61,270 |
| Czechs | 57.2 /100 | #162 | Average $61,244 |
| Ugandans | 55.5 /100 | #163 | Average $61,177 |
| Immigrants | North Macedonia | 55.4 /100 | #164 | Average $61,175 |
| Immigrants | Ukraine | 55.1 /100 | #165 | Average $61,163 |
| Immigrants | Eastern Africa | 55.0 /100 | #166 | Average $61,157 |
| Norwegians | 53.6 /100 | #167 | Average $61,104 |
| Irish | 53.4 /100 | #168 | Average $61,097 |
| Carpatho Rusyns | 53.3 /100 | #169 | Average $61,093 |
Demographics Similar to Immigrants from Nicaragua by Householder Income Over 65 years
In terms of householder income over 65 years, the demographic groups most similar to Immigrants from Nicaragua are Native/Alaskan ($52,081, a difference of 0.010%), U.S. Virgin Islander ($52,072, a difference of 0.020%), Immigrants from the Azores ($52,121, a difference of 0.070%), Creek ($51,949, a difference of 0.26%), and Immigrants from St. Vincent and the Grenadines ($51,922, a difference of 0.31%).
| Demographics | Rating | Rank | Householder Income Over 65 years |
| Pennsylvania Germans | 0.0 /100 | #306 | Tragic $52,888 |
| Hispanics or Latinos | 0.0 /100 | #307 | Tragic $52,832 |
| Immigrants | Mexico | 0.0 /100 | #308 | Tragic $52,801 |
| Hondurans | 0.0 /100 | #309 | Tragic $52,634 |
| Sioux | 0.0 /100 | #310 | Tragic $52,509 |
| Seminole | 0.0 /100 | #311 | Tragic $52,373 |
| Immigrants | Azores | 0.0 /100 | #312 | Tragic $52,121 |
| Immigrants | Nicaragua | 0.0 /100 | #313 | Tragic $52,085 |
| Natives/Alaskans | 0.0 /100 | #314 | Tragic $52,081 |
| U.S. Virgin Islanders | 0.0 /100 | #315 | Tragic $52,072 |
| Creek | 0.0 /100 | #316 | Tragic $51,949 |
| Immigrants | St. Vincent and the Grenadines | 0.0 /100 | #317 | Tragic $51,922 |
| Haitians | 0.0 /100 | #318 | Tragic $51,912 |
| Immigrants | Honduras | 0.0 /100 | #319 | Tragic $51,888 |
| Colville | 0.0 /100 | #320 | Tragic $51,739 |