Ukrainian vs Immigrants from Nicaragua Householder Income Over 65 years
COMPARE
Ukrainian
Immigrants from Nicaragua
Householder Income Over 65 years
Householder Income Over 65 years Comparison
Ukrainians
Immigrants from Nicaragua
$63,032
HOUSEHOLDER INCOME OVER 65 YEARS
89.7/ 100
METRIC RATING
120th/ 347
METRIC RANK
$52,085
HOUSEHOLDER INCOME OVER 65 YEARS
0.0/ 100
METRIC RATING
313th/ 347
METRIC RANK
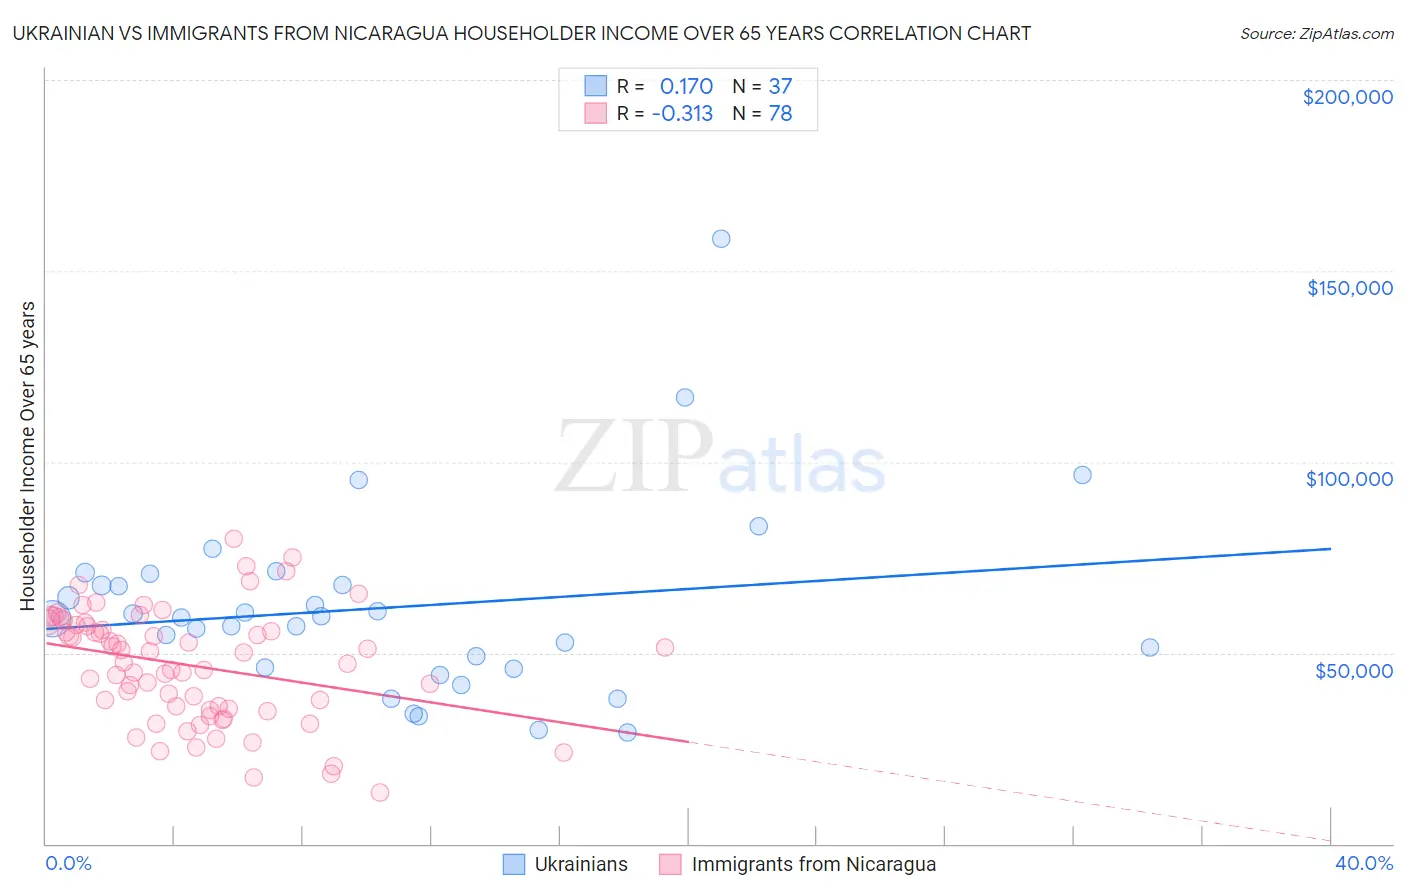
Ukrainian vs Immigrants from Nicaragua Householder Income Over 65 years Correlation Chart
The statistical analysis conducted on geographies consisting of 446,766,120 people shows a poor positive correlation between the proportion of Ukrainians and household income with householder over the age of 65 in the United States with a correlation coefficient (R) of 0.170 and weighted average of $63,032. Similarly, the statistical analysis conducted on geographies consisting of 236,036,400 people shows a mild negative correlation between the proportion of Immigrants from Nicaragua and household income with householder over the age of 65 in the United States with a correlation coefficient (R) of -0.313 and weighted average of $52,085, a difference of 21.0%.
Householder Income Over 65 years Correlation Summary
| Measurement | Ukrainian | Immigrants from Nicaragua |
| Minimum | $29,107 | $13,371 |
| Maximum | $158,278 | $80,000 |
| Range | $129,171 | $66,629 |
| Mean | $61,843 | $46,721 |
| Median | $59,148 | $48,735 |
| Interquartile 25% (IQ1) | $46,039 | $35,431 |
| Interquartile 75% (IQ3) | $69,195 | $57,245 |
| Interquartile Range (IQR) | $23,156 | $21,814 |
| Standard Deviation (Sample) | $24,881 | $14,647 |
| Standard Deviation (Population) | $24,542 | $14,553 |
Similar Demographics by Householder Income Over 65 years
Demographics Similar to Ukrainians by Householder Income Over 65 years
In terms of householder income over 65 years, the demographic groups most similar to Ukrainians are Immigrants from Jordan ($63,041, a difference of 0.010%), Immigrants from Vietnam ($63,014, a difference of 0.030%), Danish ($63,117, a difference of 0.13%), Immigrants from Moldova ($62,939, a difference of 0.15%), and Tlingit-Haida ($62,922, a difference of 0.18%).
| Demographics | Rating | Rank | Householder Income Over 65 years |
| Immigrants | Serbia | 92.7 /100 | #113 | Exceptional $63,387 |
| Immigrants | Saudi Arabia | 92.4 /100 | #114 | Exceptional $63,355 |
| Croatians | 91.4 /100 | #115 | Exceptional $63,225 |
| Guamanians/Chamorros | 91.1 /100 | #116 | Exceptional $63,187 |
| Immigrants | Croatia | 90.9 /100 | #117 | Exceptional $63,168 |
| Danes | 90.5 /100 | #118 | Exceptional $63,117 |
| Immigrants | Jordan | 89.8 /100 | #119 | Excellent $63,041 |
| Ukrainians | 89.7 /100 | #120 | Excellent $63,032 |
| Immigrants | Vietnam | 89.5 /100 | #121 | Excellent $63,014 |
| Immigrants | Moldova | 88.7 /100 | #122 | Excellent $62,939 |
| Tlingit-Haida | 88.6 /100 | #123 | Excellent $62,922 |
| Taiwanese | 88.3 /100 | #124 | Excellent $62,894 |
| Soviet Union | 87.8 /100 | #125 | Excellent $62,848 |
| Peruvians | 86.8 /100 | #126 | Excellent $62,766 |
| Swedes | 86.4 /100 | #127 | Excellent $62,736 |
Demographics Similar to Immigrants from Nicaragua by Householder Income Over 65 years
In terms of householder income over 65 years, the demographic groups most similar to Immigrants from Nicaragua are Native/Alaskan ($52,081, a difference of 0.010%), U.S. Virgin Islander ($52,072, a difference of 0.020%), Immigrants from the Azores ($52,121, a difference of 0.070%), Creek ($51,949, a difference of 0.26%), and Immigrants from St. Vincent and the Grenadines ($51,922, a difference of 0.31%).
| Demographics | Rating | Rank | Householder Income Over 65 years |
| Pennsylvania Germans | 0.0 /100 | #306 | Tragic $52,888 |
| Hispanics or Latinos | 0.0 /100 | #307 | Tragic $52,832 |
| Immigrants | Mexico | 0.0 /100 | #308 | Tragic $52,801 |
| Hondurans | 0.0 /100 | #309 | Tragic $52,634 |
| Sioux | 0.0 /100 | #310 | Tragic $52,509 |
| Seminole | 0.0 /100 | #311 | Tragic $52,373 |
| Immigrants | Azores | 0.0 /100 | #312 | Tragic $52,121 |
| Immigrants | Nicaragua | 0.0 /100 | #313 | Tragic $52,085 |
| Natives/Alaskans | 0.0 /100 | #314 | Tragic $52,081 |
| U.S. Virgin Islanders | 0.0 /100 | #315 | Tragic $52,072 |
| Creek | 0.0 /100 | #316 | Tragic $51,949 |
| Immigrants | St. Vincent and the Grenadines | 0.0 /100 | #317 | Tragic $51,922 |
| Haitians | 0.0 /100 | #318 | Tragic $51,912 |
| Immigrants | Honduras | 0.0 /100 | #319 | Tragic $51,888 |
| Colville | 0.0 /100 | #320 | Tragic $51,739 |