Immigrants from Taiwan vs Basque Householder Income Ages 45 - 64 years
COMPARE
Immigrants from Taiwan
Basque
Householder Income Ages 45 - 64 years
Householder Income Ages 45 - 64 years Comparison
Immigrants from Taiwan
Basques
$135,508
HOUSEHOLDER INCOME AGES 45 - 64 YEARS
100.0/ 100
METRIC RATING
1st/ 347
METRIC RANK
$103,387
HOUSEHOLDER INCOME AGES 45 - 64 YEARS
82.3/ 100
METRIC RATING
147th/ 347
METRIC RANK
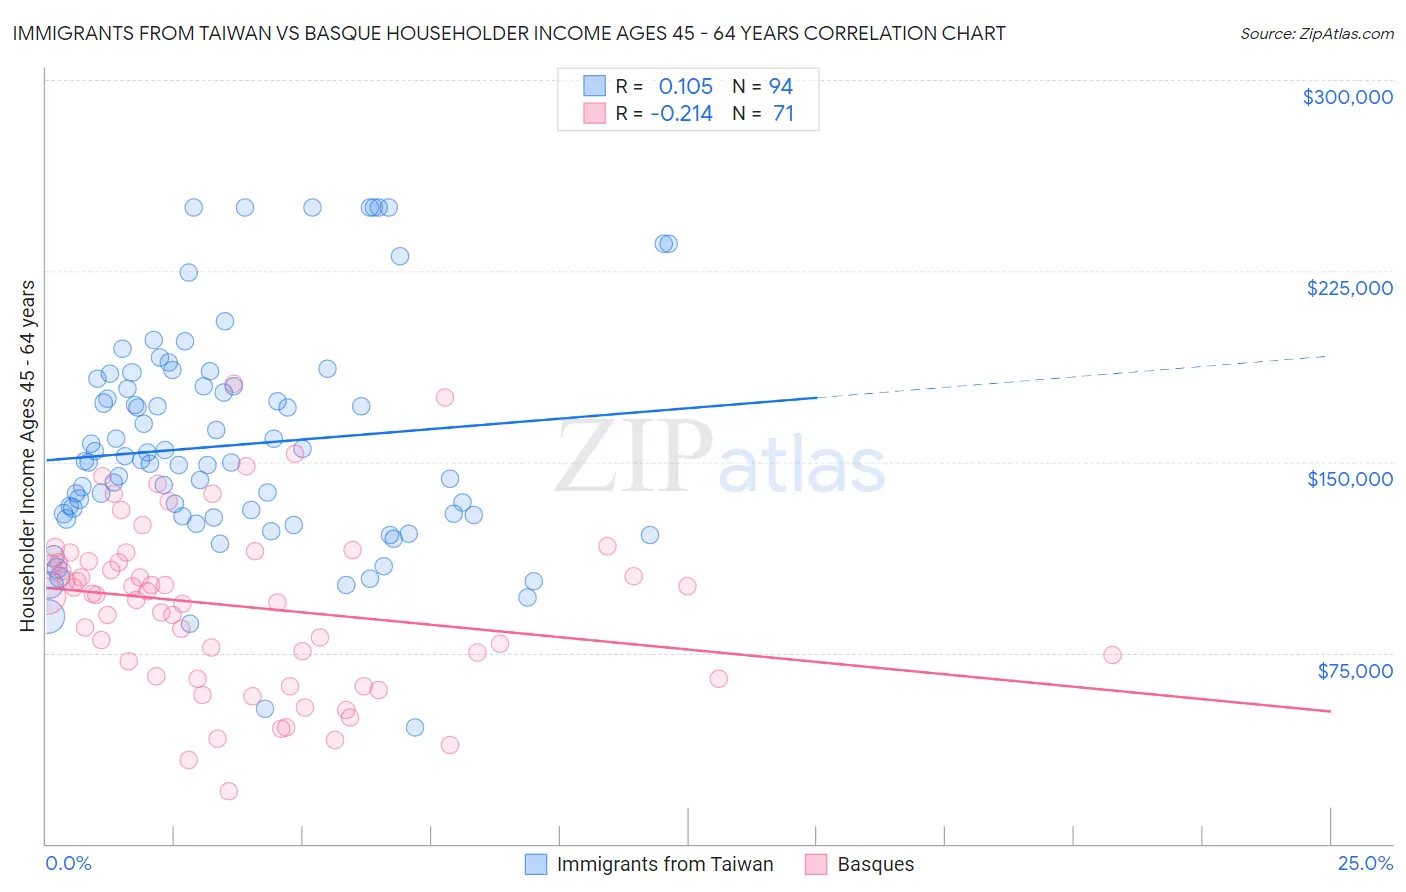
Immigrants from Taiwan vs Basque Householder Income Ages 45 - 64 years Correlation Chart
The statistical analysis conducted on geographies consisting of 297,970,743 people shows a poor positive correlation between the proportion of Immigrants from Taiwan and household income with householder between the ages 45 and 64 in the United States with a correlation coefficient (R) of 0.105 and weighted average of $135,508. Similarly, the statistical analysis conducted on geographies consisting of 165,668,497 people shows a weak negative correlation between the proportion of Basques and household income with householder between the ages 45 and 64 in the United States with a correlation coefficient (R) of -0.214 and weighted average of $103,387, a difference of 31.1%.
Householder Income Ages 45 - 64 years Correlation Summary
| Measurement | Immigrants from Taiwan | Basque |
| Minimum | $45,758 | $20,417 |
| Maximum | $250,001 | $180,563 |
| Range | $204,243 | $160,146 |
| Mean | $156,467 | $93,413 |
| Median | $150,003 | $97,827 |
| Interquartile 25% (IQ1) | $128,525 | $65,865 |
| Interquartile 75% (IQ3) | $179,879 | $110,957 |
| Interquartile Range (IQR) | $51,354 | $45,092 |
| Standard Deviation (Sample) | $43,921 | $33,150 |
| Standard Deviation (Population) | $43,687 | $32,916 |
Similar Demographics by Householder Income Ages 45 - 64 years
Demographics Similar to Immigrants from Taiwan by Householder Income Ages 45 - 64 years
In terms of householder income ages 45 - 64 years, the demographic groups most similar to Immigrants from Taiwan are Filipino ($134,910, a difference of 0.44%), Immigrants from India ($132,488, a difference of 2.3%), Thai ($129,560, a difference of 4.6%), Immigrants from Singapore ($129,514, a difference of 4.6%), and Iranian ($129,350, a difference of 4.8%).
| Demographics | Rating | Rank | Householder Income Ages 45 - 64 years |
| Immigrants | Taiwan | 100.0 /100 | #1 | Exceptional $135,508 |
| Filipinos | 100.0 /100 | #2 | Exceptional $134,910 |
| Immigrants | India | 100.0 /100 | #3 | Exceptional $132,488 |
| Thais | 100.0 /100 | #4 | Exceptional $129,560 |
| Immigrants | Singapore | 100.0 /100 | #5 | Exceptional $129,514 |
| Iranians | 100.0 /100 | #6 | Exceptional $129,350 |
| Immigrants | Hong Kong | 100.0 /100 | #7 | Exceptional $127,500 |
| Immigrants | Iran | 100.0 /100 | #8 | Exceptional $126,940 |
| Okinawans | 100.0 /100 | #9 | Exceptional $124,796 |
| Immigrants | South Central Asia | 100.0 /100 | #10 | Exceptional $124,188 |
| Cypriots | 100.0 /100 | #11 | Exceptional $123,396 |
| Immigrants | Israel | 100.0 /100 | #12 | Exceptional $122,893 |
| Immigrants | Ireland | 100.0 /100 | #13 | Exceptional $122,757 |
| Indians (Asian) | 100.0 /100 | #14 | Exceptional $122,343 |
| Immigrants | Eastern Asia | 100.0 /100 | #15 | Exceptional $122,222 |
Demographics Similar to Basques by Householder Income Ages 45 - 64 years
In terms of householder income ages 45 - 64 years, the demographic groups most similar to Basques are Immigrants from Chile ($103,412, a difference of 0.020%), Ugandan ($103,472, a difference of 0.080%), Immigrants from Germany ($103,282, a difference of 0.10%), Czech ($103,507, a difference of 0.12%), and Serbian ($103,522, a difference of 0.13%).
| Demographics | Rating | Rank | Householder Income Ages 45 - 64 years |
| Norwegians | 84.3 /100 | #140 | Excellent $103,682 |
| Immigrants | Uganda | 83.7 /100 | #141 | Excellent $103,584 |
| Luxembourgers | 83.3 /100 | #142 | Excellent $103,536 |
| Serbians | 83.2 /100 | #143 | Excellent $103,522 |
| Czechs | 83.1 /100 | #144 | Excellent $103,507 |
| Ugandans | 82.9 /100 | #145 | Excellent $103,472 |
| Immigrants | Chile | 82.5 /100 | #146 | Excellent $103,412 |
| Basques | 82.3 /100 | #147 | Excellent $103,387 |
| Immigrants | Germany | 81.5 /100 | #148 | Excellent $103,282 |
| Immigrants | Sierra Leone | 81.1 /100 | #149 | Excellent $103,227 |
| Immigrants | Peru | 80.7 /100 | #150 | Excellent $103,173 |
| Swiss | 79.9 /100 | #151 | Good $103,071 |
| Irish | 79.8 /100 | #152 | Good $103,067 |
| Scandinavians | 79.0 /100 | #153 | Good $102,969 |
| Slovenes | 78.3 /100 | #154 | Good $102,885 |