Canadian vs Immigrants from South Eastern Asia Median Family Income
COMPARE
Canadian
Immigrants from South Eastern Asia
Median Family Income
Median Family Income Comparison
Canadians
Immigrants from South Eastern Asia
$106,597
MEDIAN FAMILY INCOME
88.1/ 100
METRIC RATING
131st/ 347
METRIC RANK
$106,252
MEDIAN FAMILY INCOME
86.1/ 100
METRIC RATING
136th/ 347
METRIC RANK
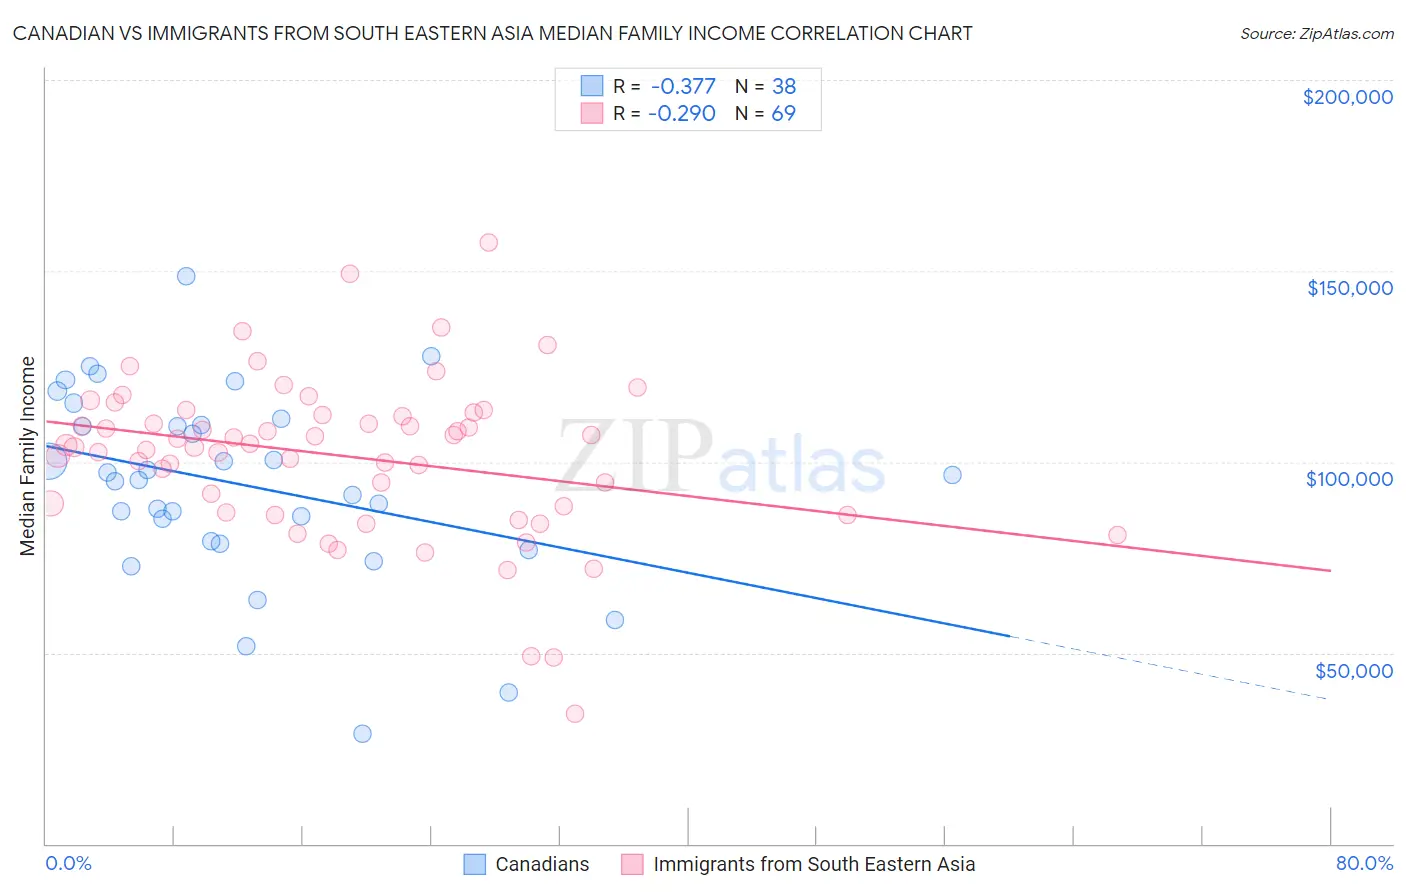
Canadian vs Immigrants from South Eastern Asia Median Family Income Correlation Chart
The statistical analysis conducted on geographies consisting of 437,117,064 people shows a mild negative correlation between the proportion of Canadians and median family income in the United States with a correlation coefficient (R) of -0.377 and weighted average of $106,597. Similarly, the statistical analysis conducted on geographies consisting of 511,889,234 people shows a weak negative correlation between the proportion of Immigrants from South Eastern Asia and median family income in the United States with a correlation coefficient (R) of -0.290 and weighted average of $106,252, a difference of 0.32%.
Median Family Income Correlation Summary
| Measurement | Canadian | Immigrants from South Eastern Asia |
| Minimum | $28,715 | $34,076 |
| Maximum | $148,748 | $157,444 |
| Range | $120,033 | $123,368 |
| Mean | $93,902 | $101,571 |
| Median | $95,805 | $104,465 |
| Interquartile 25% (IQ1) | $79,333 | $87,571 |
| Interquartile 75% (IQ3) | $109,797 | $112,620 |
| Interquartile Range (IQR) | $30,464 | $25,049 |
| Standard Deviation (Sample) | $24,866 | $21,051 |
| Standard Deviation (Population) | $24,537 | $20,898 |
Demographics Similar to Canadians and Immigrants from South Eastern Asia by Median Family Income
In terms of median family income, the demographic groups most similar to Canadians are Immigrants from Fiji ($106,544, a difference of 0.050%), Ugandan ($106,541, a difference of 0.050%), Immigrants from Oceania ($106,453, a difference of 0.14%), Portuguese ($106,286, a difference of 0.29%), and Brazilian ($106,942, a difference of 0.32%). Similarly, the demographic groups most similar to Immigrants from South Eastern Asia are Portuguese ($106,286, a difference of 0.030%), Immigrants from Uganda ($106,188, a difference of 0.060%), Immigrants from Vietnam ($106,186, a difference of 0.060%), Luxembourger ($106,183, a difference of 0.060%), and Norwegian ($106,144, a difference of 0.10%).
| Demographics | Rating | Rank | Median Family Income |
| Carpatho Rusyns | 92.2 /100 | #123 | Exceptional $107,502 |
| Pakistanis | 91.7 /100 | #124 | Exceptional $107,390 |
| Taiwanese | 91.4 /100 | #125 | Exceptional $107,295 |
| Serbians | 90.8 /100 | #126 | Exceptional $107,157 |
| Lebanese | 90.5 /100 | #127 | Exceptional $107,086 |
| Immigrants | Ethiopia | 90.0 /100 | #128 | Excellent $106,969 |
| Arabs | 89.9 /100 | #129 | Excellent $106,952 |
| Brazilians | 89.8 /100 | #130 | Excellent $106,942 |
| Canadians | 88.1 /100 | #131 | Excellent $106,597 |
| Immigrants | Fiji | 87.8 /100 | #132 | Excellent $106,544 |
| Ugandans | 87.8 /100 | #133 | Excellent $106,541 |
| Immigrants | Oceania | 87.3 /100 | #134 | Excellent $106,453 |
| Portuguese | 86.3 /100 | #135 | Excellent $106,286 |
| Immigrants | South Eastern Asia | 86.1 /100 | #136 | Excellent $106,252 |
| Immigrants | Uganda | 85.7 /100 | #137 | Excellent $106,188 |
| Immigrants | Vietnam | 85.7 /100 | #138 | Excellent $106,186 |
| Luxembourgers | 85.7 /100 | #139 | Excellent $106,183 |
| Norwegians | 85.5 /100 | #140 | Excellent $106,144 |
| Immigrants | Syria | 85.3 /100 | #141 | Excellent $106,118 |
| Slovenes | 84.7 /100 | #142 | Excellent $106,020 |
| Tongans | 84.3 /100 | #143 | Excellent $105,967 |