Lebanese vs Greek Median Household Income
COMPARE
Lebanese
Greek
Median Household Income
Median Household Income Comparison
Lebanese
Greeks
$88,091
MEDIAN HOUSEHOLD INCOME
87.2/ 100
METRIC RATING
140th/ 347
METRIC RANK
$94,735
MEDIAN HOUSEHOLD INCOME
99.8/ 100
METRIC RATING
63rd/ 347
METRIC RANK
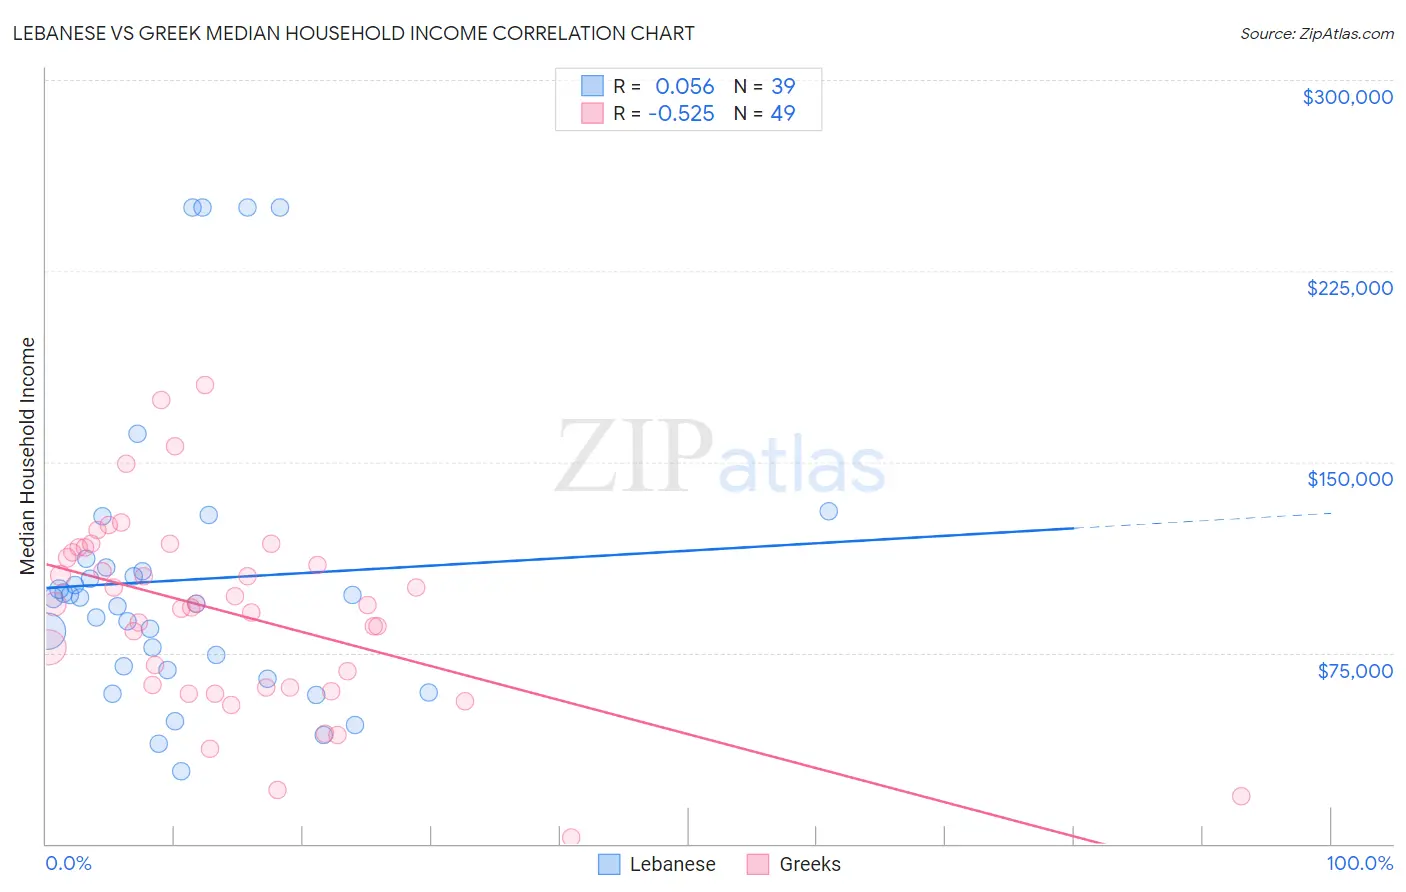
Lebanese vs Greek Median Household Income Correlation Chart
The statistical analysis conducted on geographies consisting of 401,232,119 people shows a slight positive correlation between the proportion of Lebanese and median household income in the United States with a correlation coefficient (R) of 0.056 and weighted average of $88,091. Similarly, the statistical analysis conducted on geographies consisting of 482,222,552 people shows a substantial negative correlation between the proportion of Greeks and median household income in the United States with a correlation coefficient (R) of -0.525 and weighted average of $94,735, a difference of 7.5%.
Median Household Income Correlation Summary
| Measurement | Lebanese | Greek |
| Minimum | $28,348 | $2,499 |
| Maximum | $250,001 | $180,197 |
| Range | $221,653 | $177,698 |
| Mean | $103,665 | $90,436 |
| Median | $96,621 | $93,750 |
| Interquartile 25% (IQ1) | $68,125 | $61,372 |
| Interquartile 75% (IQ3) | $108,387 | $115,471 |
| Interquartile Range (IQR) | $40,262 | $54,098 |
| Standard Deviation (Sample) | $57,143 | $37,295 |
| Standard Deviation (Population) | $56,406 | $36,913 |
Similar Demographics by Median Household Income
Demographics Similar to Lebanese by Median Household Income
In terms of median household income, the demographic groups most similar to Lebanese are Immigrants from Morocco ($87,930, a difference of 0.18%), Immigrants from Chile ($88,388, a difference of 0.34%), Arab ($88,398, a difference of 0.35%), Canadian ($87,769, a difference of 0.37%), and Sierra Leonean ($88,463, a difference of 0.42%).
| Demographics | Rating | Rank | Median Household Income |
| Immigrants | Ethiopia | 90.9 /100 | #133 | Exceptional $88,687 |
| Swedes | 90.0 /100 | #134 | Exceptional $88,524 |
| Immigrants | Sierra Leone | 89.9 /100 | #135 | Excellent $88,498 |
| Poles | 89.7 /100 | #136 | Excellent $88,472 |
| Sierra Leoneans | 89.6 /100 | #137 | Excellent $88,463 |
| Arabs | 89.2 /100 | #138 | Excellent $88,398 |
| Immigrants | Chile | 89.2 /100 | #139 | Excellent $88,388 |
| Lebanese | 87.2 /100 | #140 | Excellent $88,091 |
| Immigrants | Morocco | 86.0 /100 | #141 | Excellent $87,930 |
| Canadians | 84.7 /100 | #142 | Excellent $87,769 |
| Danes | 83.9 /100 | #143 | Excellent $87,676 |
| Serbians | 83.0 /100 | #144 | Excellent $87,572 |
| Ugandans | 82.9 /100 | #145 | Excellent $87,557 |
| Immigrants | Uganda | 82.8 /100 | #146 | Excellent $87,553 |
| South American Indians | 81.8 /100 | #147 | Excellent $87,446 |
Demographics Similar to Greeks by Median Household Income
In terms of median household income, the demographic groups most similar to Greeks are Immigrants from Norway ($94,846, a difference of 0.12%), Laotian ($94,990, a difference of 0.27%), Korean ($95,018, a difference of 0.30%), Immigrants from Europe ($95,032, a difference of 0.31%), and Immigrants from Netherlands ($94,411, a difference of 0.34%).
| Demographics | Rating | Rank | Median Household Income |
| Immigrants | Austria | 99.9 /100 | #56 | Exceptional $95,277 |
| New Zealanders | 99.8 /100 | #57 | Exceptional $95,146 |
| Soviet Union | 99.8 /100 | #58 | Exceptional $95,098 |
| Immigrants | Europe | 99.8 /100 | #59 | Exceptional $95,032 |
| Koreans | 99.8 /100 | #60 | Exceptional $95,018 |
| Laotians | 99.8 /100 | #61 | Exceptional $94,990 |
| Immigrants | Norway | 99.8 /100 | #62 | Exceptional $94,846 |
| Greeks | 99.8 /100 | #63 | Exceptional $94,735 |
| Immigrants | Netherlands | 99.7 /100 | #64 | Exceptional $94,411 |
| Immigrants | Belarus | 99.7 /100 | #65 | Exceptional $94,399 |
| Immigrants | Romania | 99.7 /100 | #66 | Exceptional $94,222 |
| Immigrants | Scotland | 99.7 /100 | #67 | Exceptional $94,091 |
| Mongolians | 99.7 /100 | #68 | Exceptional $93,971 |
| Argentineans | 99.7 /100 | #69 | Exceptional $93,960 |
| Immigrants | Fiji | 99.7 /100 | #70 | Exceptional $93,933 |