Burmese vs Chippewa Householder Income Ages 25 - 44 years
COMPARE
Burmese
Chippewa
Householder Income Ages 25 - 44 years
Householder Income Ages 25 - 44 years Comparison
Burmese
Chippewa
$113,701
HOUSEHOLDER INCOME AGES 25 - 44 YEARS
100.0/ 100
METRIC RATING
19th/ 347
METRIC RANK
$80,005
HOUSEHOLDER INCOME AGES 25 - 44 YEARS
0.0/ 100
METRIC RATING
309th/ 347
METRIC RANK
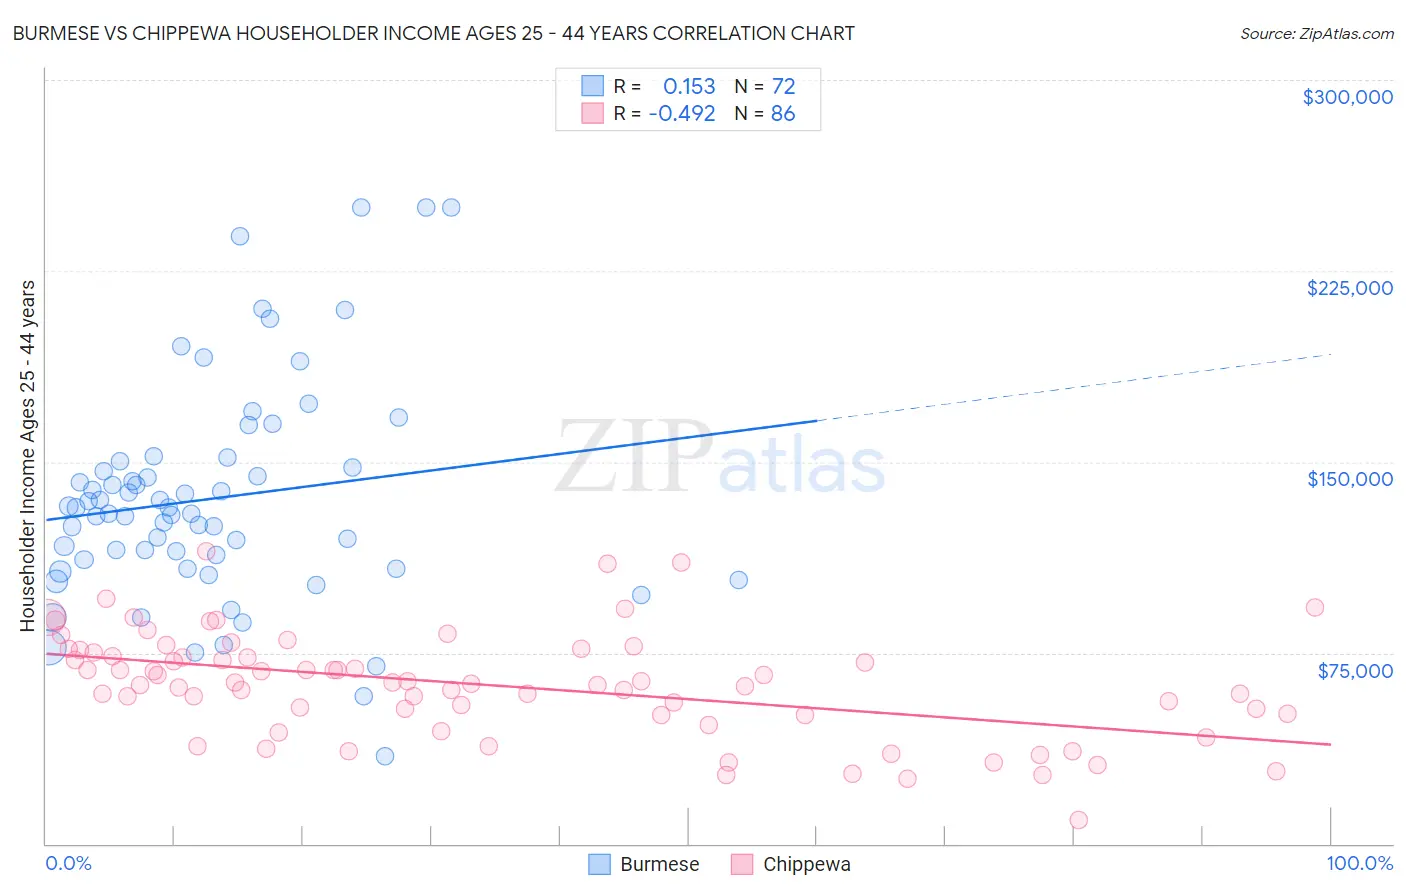
Burmese vs Chippewa Householder Income Ages 25 - 44 years Correlation Chart
The statistical analysis conducted on geographies consisting of 463,720,285 people shows a poor positive correlation between the proportion of Burmese and household income with householder between the ages 25 and 44 in the United States with a correlation coefficient (R) of 0.153 and weighted average of $113,701. Similarly, the statistical analysis conducted on geographies consisting of 214,656,590 people shows a moderate negative correlation between the proportion of Chippewa and household income with householder between the ages 25 and 44 in the United States with a correlation coefficient (R) of -0.492 and weighted average of $80,005, a difference of 42.1%.
Householder Income Ages 25 - 44 years Correlation Summary
| Measurement | Burmese | Chippewa |
| Minimum | $34,375 | $9,500 |
| Maximum | $250,001 | $114,792 |
| Range | $215,626 | $105,292 |
| Mean | $135,614 | $62,281 |
| Median | $130,767 | $63,204 |
| Interquartile 25% (IQ1) | $109,816 | $50,634 |
| Interquartile 75% (IQ3) | $149,069 | $75,056 |
| Interquartile Range (IQR) | $39,253 | $24,422 |
| Standard Deviation (Sample) | $43,392 | $20,701 |
| Standard Deviation (Population) | $43,090 | $20,580 |
Similar Demographics by Householder Income Ages 25 - 44 years
Demographics Similar to Burmese by Householder Income Ages 25 - 44 years
In terms of householder income ages 25 - 44 years, the demographic groups most similar to Burmese are Immigrants from Korea ($113,401, a difference of 0.26%), Eastern European ($114,523, a difference of 0.72%), Asian ($112,666, a difference of 0.92%), Immigrants from Belgium ($112,575, a difference of 1.0%), and Immigrants from Japan ($112,228, a difference of 1.3%).
| Demographics | Rating | Rank | Householder Income Ages 25 - 44 years |
| Immigrants | Iran | 100.0 /100 | #12 | Exceptional $119,204 |
| Immigrants | Eastern Asia | 100.0 /100 | #13 | Exceptional $118,056 |
| Immigrants | Israel | 100.0 /100 | #14 | Exceptional $117,219 |
| Immigrants | South Central Asia | 100.0 /100 | #15 | Exceptional $116,626 |
| Cypriots | 100.0 /100 | #16 | Exceptional $116,364 |
| Immigrants | Australia | 100.0 /100 | #17 | Exceptional $115,947 |
| Eastern Europeans | 100.0 /100 | #18 | Exceptional $114,523 |
| Burmese | 100.0 /100 | #19 | Exceptional $113,701 |
| Immigrants | Korea | 100.0 /100 | #20 | Exceptional $113,401 |
| Asians | 100.0 /100 | #21 | Exceptional $112,666 |
| Immigrants | Belgium | 100.0 /100 | #22 | Exceptional $112,575 |
| Immigrants | Japan | 100.0 /100 | #23 | Exceptional $112,228 |
| Immigrants | Sweden | 100.0 /100 | #24 | Exceptional $112,010 |
| Immigrants | Northern Europe | 100.0 /100 | #25 | Exceptional $111,676 |
| Immigrants | Asia | 100.0 /100 | #26 | Exceptional $110,787 |
Demographics Similar to Chippewa by Householder Income Ages 25 - 44 years
In terms of householder income ages 25 - 44 years, the demographic groups most similar to Chippewa are Immigrants from Central America ($80,012, a difference of 0.010%), Haitian ($80,055, a difference of 0.060%), Fijian ($79,956, a difference of 0.060%), Apache ($80,260, a difference of 0.32%), and Immigrants from Dominican Republic ($80,319, a difference of 0.39%).
| Demographics | Rating | Rank | Householder Income Ages 25 - 44 years |
| Hispanics or Latinos | 0.0 /100 | #302 | Tragic $80,515 |
| Mexicans | 0.0 /100 | #303 | Tragic $80,427 |
| Immigrants | Caribbean | 0.0 /100 | #304 | Tragic $80,326 |
| Immigrants | Dominican Republic | 0.0 /100 | #305 | Tragic $80,319 |
| Apache | 0.0 /100 | #306 | Tragic $80,260 |
| Haitians | 0.0 /100 | #307 | Tragic $80,055 |
| Immigrants | Central America | 0.0 /100 | #308 | Tragic $80,012 |
| Chippewa | 0.0 /100 | #309 | Tragic $80,005 |
| Fijians | 0.0 /100 | #310 | Tragic $79,956 |
| Indonesians | 0.0 /100 | #311 | Tragic $79,543 |
| Immigrants | Haiti | 0.0 /100 | #312 | Tragic $79,391 |
| Menominee | 0.0 /100 | #313 | Tragic $79,358 |
| Cheyenne | 0.0 /100 | #314 | Tragic $79,152 |
| Ottawa | 0.0 /100 | #315 | Tragic $79,012 |
| Africans | 0.0 /100 | #316 | Tragic $78,986 |