Burmese vs Swiss Householder Income Ages 25 - 44 years
COMPARE
Burmese
Swiss
Householder Income Ages 25 - 44 years
Householder Income Ages 25 - 44 years Comparison
Burmese
Swiss
$113,701
HOUSEHOLDER INCOME AGES 25 - 44 YEARS
100.0/ 100
METRIC RATING
19th/ 347
METRIC RANK
$95,511
HOUSEHOLDER INCOME AGES 25 - 44 YEARS
62.8/ 100
METRIC RATING
162nd/ 347
METRIC RANK
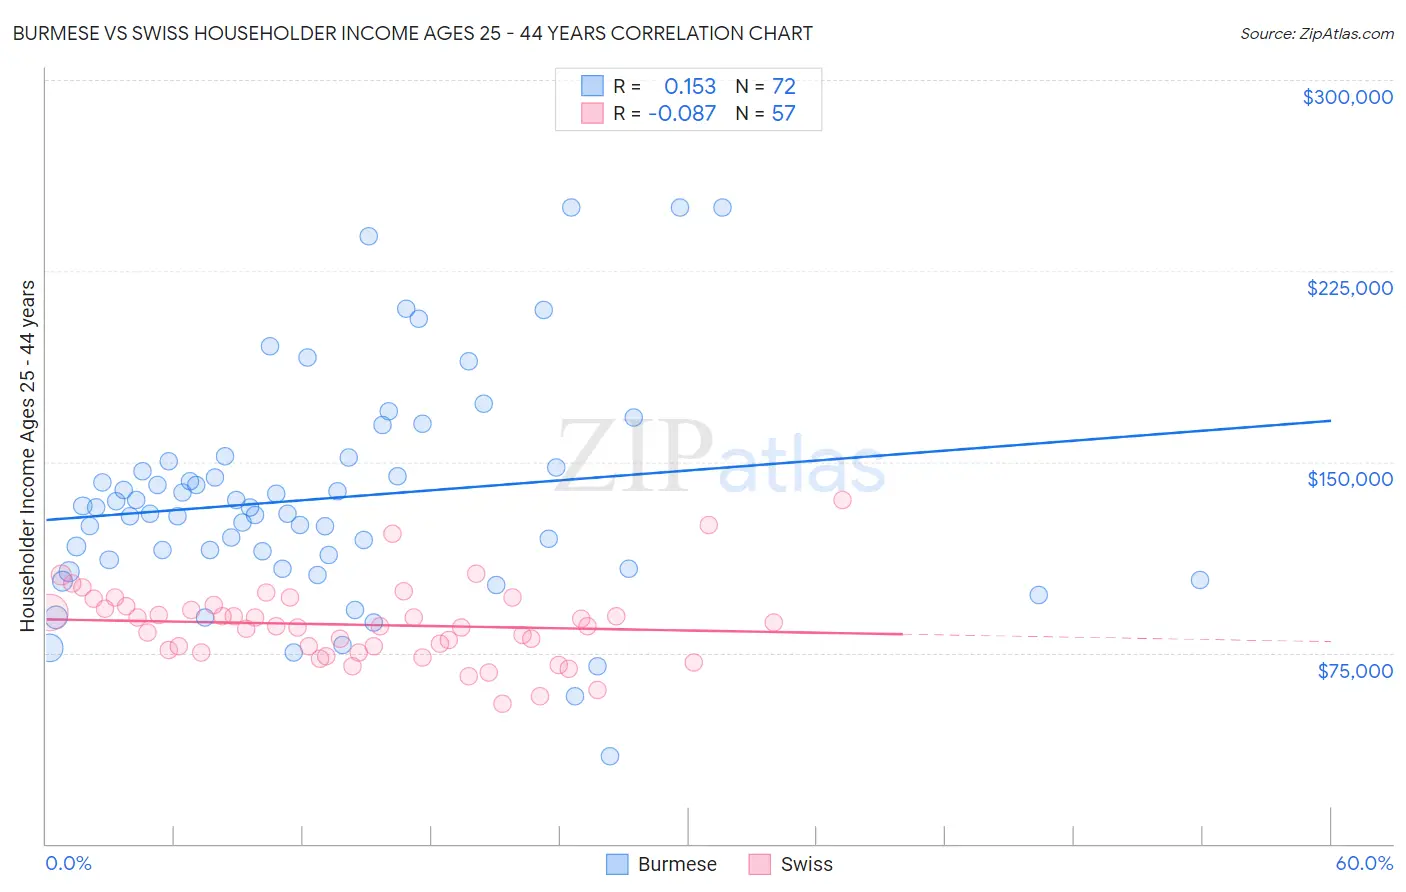
Burmese vs Swiss Householder Income Ages 25 - 44 years Correlation Chart
The statistical analysis conducted on geographies consisting of 463,720,285 people shows a poor positive correlation between the proportion of Burmese and household income with householder between the ages 25 and 44 in the United States with a correlation coefficient (R) of 0.153 and weighted average of $113,701. Similarly, the statistical analysis conducted on geographies consisting of 463,021,921 people shows a slight negative correlation between the proportion of Swiss and household income with householder between the ages 25 and 44 in the United States with a correlation coefficient (R) of -0.087 and weighted average of $95,511, a difference of 19.1%.
Householder Income Ages 25 - 44 years Correlation Summary
| Measurement | Burmese | Swiss |
| Minimum | $34,375 | $54,762 |
| Maximum | $250,001 | $135,000 |
| Range | $215,626 | $80,238 |
| Mean | $135,614 | $86,015 |
| Median | $130,767 | $85,408 |
| Interquartile 25% (IQ1) | $109,816 | $75,688 |
| Interquartile 75% (IQ3) | $149,069 | $93,608 |
| Interquartile Range (IQR) | $39,253 | $17,920 |
| Standard Deviation (Sample) | $43,392 | $15,233 |
| Standard Deviation (Population) | $43,090 | $15,098 |
Similar Demographics by Householder Income Ages 25 - 44 years
Demographics Similar to Burmese by Householder Income Ages 25 - 44 years
In terms of householder income ages 25 - 44 years, the demographic groups most similar to Burmese are Immigrants from Korea ($113,401, a difference of 0.26%), Eastern European ($114,523, a difference of 0.72%), Asian ($112,666, a difference of 0.92%), Immigrants from Belgium ($112,575, a difference of 1.0%), and Immigrants from Japan ($112,228, a difference of 1.3%).
| Demographics | Rating | Rank | Householder Income Ages 25 - 44 years |
| Immigrants | Iran | 100.0 /100 | #12 | Exceptional $119,204 |
| Immigrants | Eastern Asia | 100.0 /100 | #13 | Exceptional $118,056 |
| Immigrants | Israel | 100.0 /100 | #14 | Exceptional $117,219 |
| Immigrants | South Central Asia | 100.0 /100 | #15 | Exceptional $116,626 |
| Cypriots | 100.0 /100 | #16 | Exceptional $116,364 |
| Immigrants | Australia | 100.0 /100 | #17 | Exceptional $115,947 |
| Eastern Europeans | 100.0 /100 | #18 | Exceptional $114,523 |
| Burmese | 100.0 /100 | #19 | Exceptional $113,701 |
| Immigrants | Korea | 100.0 /100 | #20 | Exceptional $113,401 |
| Asians | 100.0 /100 | #21 | Exceptional $112,666 |
| Immigrants | Belgium | 100.0 /100 | #22 | Exceptional $112,575 |
| Immigrants | Japan | 100.0 /100 | #23 | Exceptional $112,228 |
| Immigrants | Sweden | 100.0 /100 | #24 | Exceptional $112,010 |
| Immigrants | Northern Europe | 100.0 /100 | #25 | Exceptional $111,676 |
| Immigrants | Asia | 100.0 /100 | #26 | Exceptional $110,787 |
Demographics Similar to Swiss by Householder Income Ages 25 - 44 years
In terms of householder income ages 25 - 44 years, the demographic groups most similar to Swiss are Immigrants from Portugal ($95,512, a difference of 0.0%), Icelander ($95,560, a difference of 0.050%), Costa Rican ($95,565, a difference of 0.060%), Immigrants from Saudi Arabia ($95,450, a difference of 0.060%), and Scandinavian ($95,596, a difference of 0.090%).
| Demographics | Rating | Rank | Householder Income Ages 25 - 44 years |
| Moroccans | 70.3 /100 | #155 | Good $96,117 |
| Immigrants | Germany | 67.9 /100 | #156 | Good $95,913 |
| Immigrants | Uganda | 65.2 /100 | #157 | Good $95,698 |
| Scandinavians | 63.9 /100 | #158 | Good $95,596 |
| Costa Ricans | 63.5 /100 | #159 | Good $95,565 |
| Icelanders | 63.4 /100 | #160 | Good $95,560 |
| Immigrants | Portugal | 62.8 /100 | #161 | Good $95,512 |
| Swiss | 62.8 /100 | #162 | Good $95,511 |
| Immigrants | Saudi Arabia | 62.0 /100 | #163 | Good $95,450 |
| South Americans | 60.9 /100 | #164 | Good $95,362 |
| Immigrants | Nepal | 60.3 /100 | #165 | Good $95,322 |
| Immigrants | Ethiopia | 59.5 /100 | #166 | Average $95,256 |
| Czechoslovakians | 57.0 /100 | #167 | Average $95,070 |
| Alsatians | 56.8 /100 | #168 | Average $95,059 |
| Native Hawaiians | 56.8 /100 | #169 | Average $95,058 |