Basque vs Chippewa Householder Income Ages 25 - 44 years
COMPARE
Basque
Chippewa
Householder Income Ages 25 - 44 years
Householder Income Ages 25 - 44 years Comparison
Basques
Chippewa
$96,709
HOUSEHOLDER INCOME AGES 25 - 44 YEARS
76.6/ 100
METRIC RATING
149th/ 347
METRIC RANK
$80,005
HOUSEHOLDER INCOME AGES 25 - 44 YEARS
0.0/ 100
METRIC RATING
309th/ 347
METRIC RANK
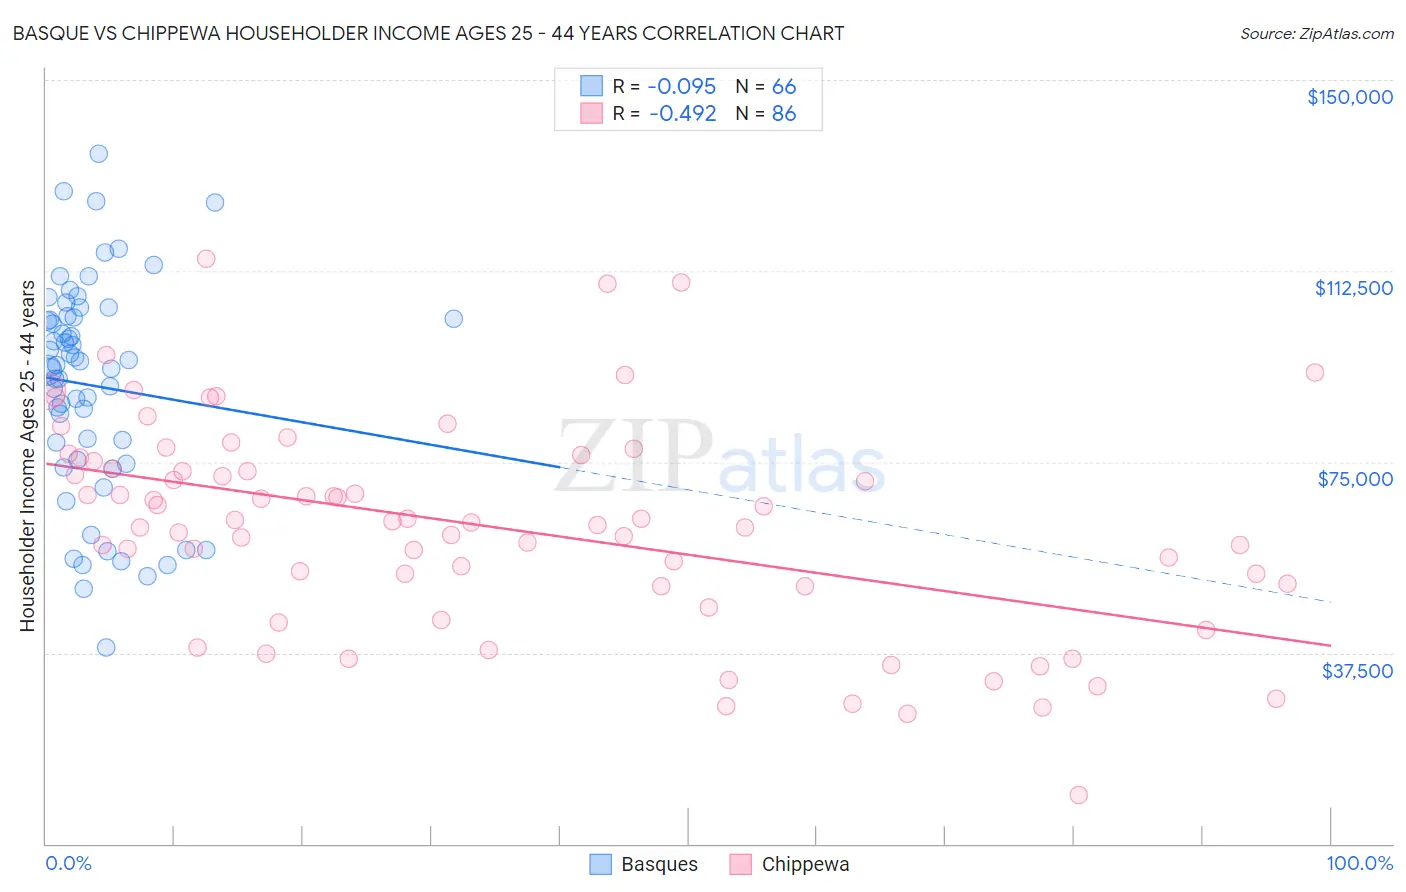
Basque vs Chippewa Householder Income Ages 25 - 44 years Correlation Chart
The statistical analysis conducted on geographies consisting of 165,637,052 people shows a slight negative correlation between the proportion of Basques and household income with householder between the ages 25 and 44 in the United States with a correlation coefficient (R) of -0.095 and weighted average of $96,709. Similarly, the statistical analysis conducted on geographies consisting of 214,656,590 people shows a moderate negative correlation between the proportion of Chippewa and household income with householder between the ages 25 and 44 in the United States with a correlation coefficient (R) of -0.492 and weighted average of $80,005, a difference of 20.9%.
Householder Income Ages 25 - 44 years Correlation Summary
| Measurement | Basque | Chippewa |
| Minimum | $38,438 | $9,500 |
| Maximum | $135,625 | $114,792 |
| Range | $97,187 | $105,292 |
| Mean | $89,960 | $62,281 |
| Median | $93,797 | $63,204 |
| Interquartile 25% (IQ1) | $75,288 | $50,634 |
| Interquartile 75% (IQ3) | $103,321 | $75,056 |
| Interquartile Range (IQR) | $28,033 | $24,422 |
| Standard Deviation (Sample) | $21,216 | $20,701 |
| Standard Deviation (Population) | $21,055 | $20,580 |
Similar Demographics by Householder Income Ages 25 - 44 years
Demographics Similar to Basques by Householder Income Ages 25 - 44 years
In terms of householder income ages 25 - 44 years, the demographic groups most similar to Basques are Irish ($96,730, a difference of 0.020%), Ugandan ($96,667, a difference of 0.040%), Immigrants from Syria ($96,789, a difference of 0.080%), Ethiopian ($96,824, a difference of 0.12%), and Norwegian ($96,866, a difference of 0.16%).
| Demographics | Rating | Rank | Householder Income Ages 25 - 44 years |
| Danes | 81.3 /100 | #142 | Excellent $97,221 |
| Immigrants | Jordan | 81.0 /100 | #143 | Excellent $97,185 |
| Immigrants | Chile | 80.8 /100 | #144 | Excellent $97,159 |
| Norwegians | 78.2 /100 | #145 | Good $96,866 |
| Ethiopians | 77.8 /100 | #146 | Good $96,824 |
| Immigrants | Syria | 77.4 /100 | #147 | Good $96,789 |
| Irish | 76.9 /100 | #148 | Good $96,730 |
| Basques | 76.6 /100 | #149 | Good $96,709 |
| Ugandans | 76.2 /100 | #150 | Good $96,667 |
| Czechs | 74.8 /100 | #151 | Good $96,525 |
| South American Indians | 74.5 /100 | #152 | Good $96,497 |
| Slovenes | 73.9 /100 | #153 | Good $96,439 |
| Slavs | 73.2 /100 | #154 | Good $96,377 |
| Moroccans | 70.3 /100 | #155 | Good $96,117 |
| Immigrants | Germany | 67.9 /100 | #156 | Good $95,913 |
Demographics Similar to Chippewa by Householder Income Ages 25 - 44 years
In terms of householder income ages 25 - 44 years, the demographic groups most similar to Chippewa are Immigrants from Central America ($80,012, a difference of 0.010%), Haitian ($80,055, a difference of 0.060%), Fijian ($79,956, a difference of 0.060%), Apache ($80,260, a difference of 0.32%), and Immigrants from Dominican Republic ($80,319, a difference of 0.39%).
| Demographics | Rating | Rank | Householder Income Ages 25 - 44 years |
| Hispanics or Latinos | 0.0 /100 | #302 | Tragic $80,515 |
| Mexicans | 0.0 /100 | #303 | Tragic $80,427 |
| Immigrants | Caribbean | 0.0 /100 | #304 | Tragic $80,326 |
| Immigrants | Dominican Republic | 0.0 /100 | #305 | Tragic $80,319 |
| Apache | 0.0 /100 | #306 | Tragic $80,260 |
| Haitians | 0.0 /100 | #307 | Tragic $80,055 |
| Immigrants | Central America | 0.0 /100 | #308 | Tragic $80,012 |
| Chippewa | 0.0 /100 | #309 | Tragic $80,005 |
| Fijians | 0.0 /100 | #310 | Tragic $79,956 |
| Indonesians | 0.0 /100 | #311 | Tragic $79,543 |
| Immigrants | Haiti | 0.0 /100 | #312 | Tragic $79,391 |
| Menominee | 0.0 /100 | #313 | Tragic $79,358 |
| Cheyenne | 0.0 /100 | #314 | Tragic $79,152 |
| Ottawa | 0.0 /100 | #315 | Tragic $79,012 |
| Africans | 0.0 /100 | #316 | Tragic $78,986 |