Colville vs Chippewa Householder Income Ages 25 - 44 years
COMPARE
Colville
Chippewa
Householder Income Ages 25 - 44 years
Householder Income Ages 25 - 44 years Comparison
Colville
Chippewa
$82,604
HOUSEHOLDER INCOME AGES 25 - 44 YEARS
0.1/ 100
METRIC RATING
280th/ 347
METRIC RANK
$80,005
HOUSEHOLDER INCOME AGES 25 - 44 YEARS
0.0/ 100
METRIC RATING
309th/ 347
METRIC RANK
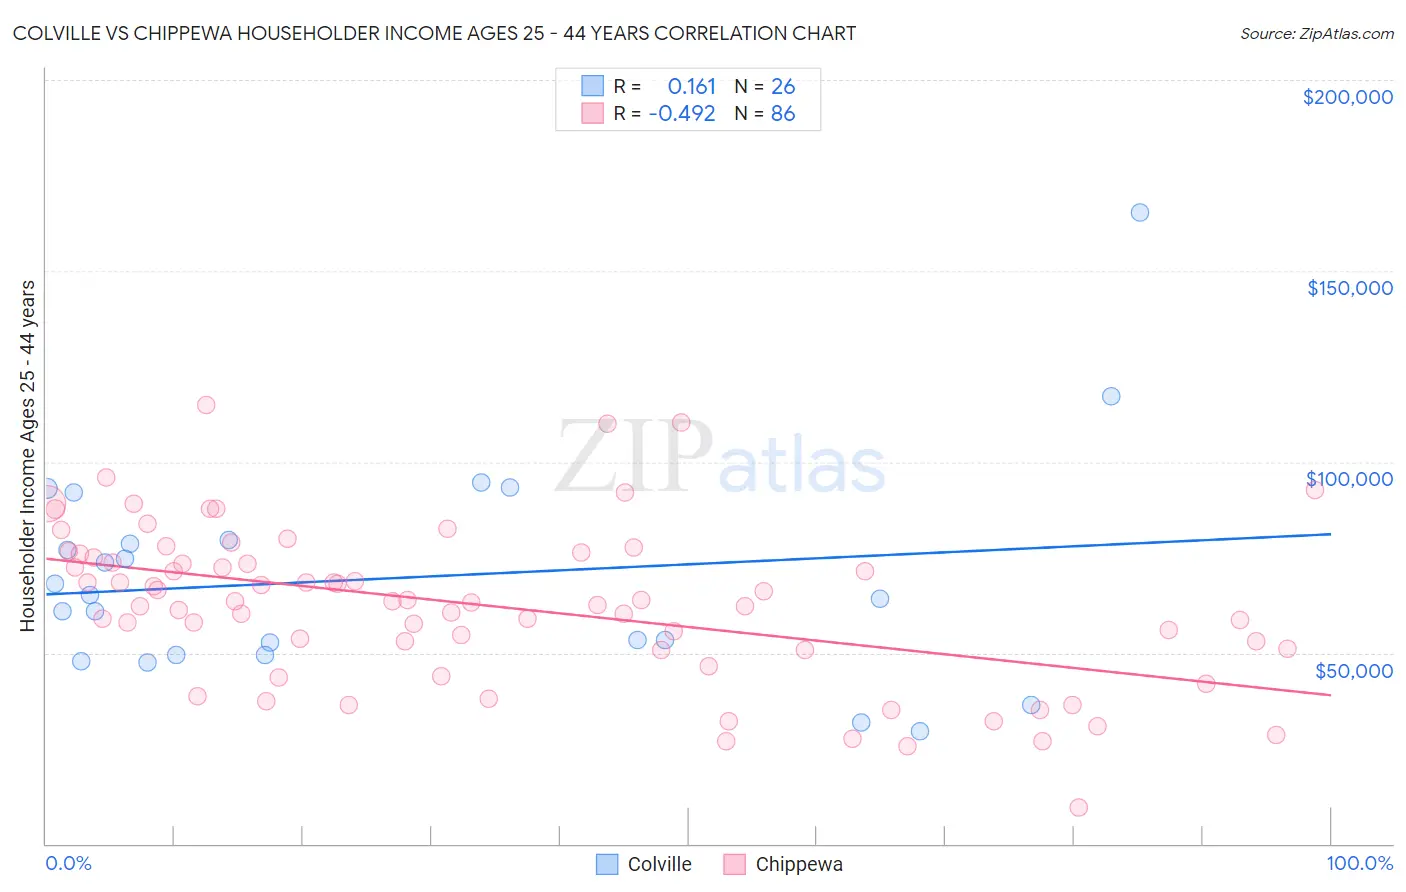
Colville vs Chippewa Householder Income Ages 25 - 44 years Correlation Chart
The statistical analysis conducted on geographies consisting of 34,657,772 people shows a poor positive correlation between the proportion of Colville and household income with householder between the ages 25 and 44 in the United States with a correlation coefficient (R) of 0.161 and weighted average of $82,604. Similarly, the statistical analysis conducted on geographies consisting of 214,656,590 people shows a moderate negative correlation between the proportion of Chippewa and household income with householder between the ages 25 and 44 in the United States with a correlation coefficient (R) of -0.492 and weighted average of $80,005, a difference of 3.3%.
Householder Income Ages 25 - 44 years Correlation Summary
| Measurement | Colville | Chippewa |
| Minimum | $29,375 | $9,500 |
| Maximum | $165,278 | $114,792 |
| Range | $135,903 | $105,292 |
| Mean | $69,577 | $62,281 |
| Median | $64,641 | $63,204 |
| Interquartile 25% (IQ1) | $49,583 | $50,634 |
| Interquartile 75% (IQ3) | $79,688 | $75,056 |
| Interquartile Range (IQR) | $30,105 | $24,422 |
| Standard Deviation (Sample) | $28,891 | $20,701 |
| Standard Deviation (Population) | $28,330 | $20,580 |
Similar Demographics by Householder Income Ages 25 - 44 years
Demographics Similar to Colville by Householder Income Ages 25 - 44 years
In terms of householder income ages 25 - 44 years, the demographic groups most similar to Colville are Pima ($82,821, a difference of 0.26%), Cajun ($82,393, a difference of 0.26%), Senegalese ($82,852, a difference of 0.30%), Central American Indian ($82,355, a difference of 0.30%), and Guatemalan ($82,331, a difference of 0.33%).
| Demographics | Rating | Rank | Householder Income Ages 25 - 44 years |
| Iroquois | 0.2 /100 | #273 | Tragic $83,682 |
| Marshallese | 0.2 /100 | #274 | Tragic $83,575 |
| Immigrants | Jamaica | 0.2 /100 | #275 | Tragic $83,298 |
| Immigrants | Belize | 0.2 /100 | #276 | Tragic $83,141 |
| Paiute | 0.2 /100 | #277 | Tragic $82,984 |
| Senegalese | 0.2 /100 | #278 | Tragic $82,852 |
| Pima | 0.1 /100 | #279 | Tragic $82,821 |
| Colville | 0.1 /100 | #280 | Tragic $82,604 |
| Cajuns | 0.1 /100 | #281 | Tragic $82,393 |
| Central American Indians | 0.1 /100 | #282 | Tragic $82,355 |
| Guatemalans | 0.1 /100 | #283 | Tragic $82,331 |
| Immigrants | Middle Africa | 0.1 /100 | #284 | Tragic $82,254 |
| Immigrants | Somalia | 0.1 /100 | #285 | Tragic $82,188 |
| Ute | 0.1 /100 | #286 | Tragic $82,166 |
| Immigrants | Latin America | 0.1 /100 | #287 | Tragic $82,166 |
Demographics Similar to Chippewa by Householder Income Ages 25 - 44 years
In terms of householder income ages 25 - 44 years, the demographic groups most similar to Chippewa are Immigrants from Central America ($80,012, a difference of 0.010%), Haitian ($80,055, a difference of 0.060%), Fijian ($79,956, a difference of 0.060%), Apache ($80,260, a difference of 0.32%), and Immigrants from Dominican Republic ($80,319, a difference of 0.39%).
| Demographics | Rating | Rank | Householder Income Ages 25 - 44 years |
| Hispanics or Latinos | 0.0 /100 | #302 | Tragic $80,515 |
| Mexicans | 0.0 /100 | #303 | Tragic $80,427 |
| Immigrants | Caribbean | 0.0 /100 | #304 | Tragic $80,326 |
| Immigrants | Dominican Republic | 0.0 /100 | #305 | Tragic $80,319 |
| Apache | 0.0 /100 | #306 | Tragic $80,260 |
| Haitians | 0.0 /100 | #307 | Tragic $80,055 |
| Immigrants | Central America | 0.0 /100 | #308 | Tragic $80,012 |
| Chippewa | 0.0 /100 | #309 | Tragic $80,005 |
| Fijians | 0.0 /100 | #310 | Tragic $79,956 |
| Indonesians | 0.0 /100 | #311 | Tragic $79,543 |
| Immigrants | Haiti | 0.0 /100 | #312 | Tragic $79,391 |
| Menominee | 0.0 /100 | #313 | Tragic $79,358 |
| Cheyenne | 0.0 /100 | #314 | Tragic $79,152 |
| Ottawa | 0.0 /100 | #315 | Tragic $79,012 |
| Africans | 0.0 /100 | #316 | Tragic $78,986 |