Burmese vs Assyrian/Chaldean/Syriac Householder Income Ages 25 - 44 years
COMPARE
Burmese
Assyrian/Chaldean/Syriac
Householder Income Ages 25 - 44 years
Householder Income Ages 25 - 44 years Comparison
Burmese
Assyrians/Chaldeans/Syriacs
$113,701
HOUSEHOLDER INCOME AGES 25 - 44 YEARS
100.0/ 100
METRIC RATING
19th/ 347
METRIC RANK
$101,936
HOUSEHOLDER INCOME AGES 25 - 44 YEARS
98.3/ 100
METRIC RATING
95th/ 347
METRIC RANK
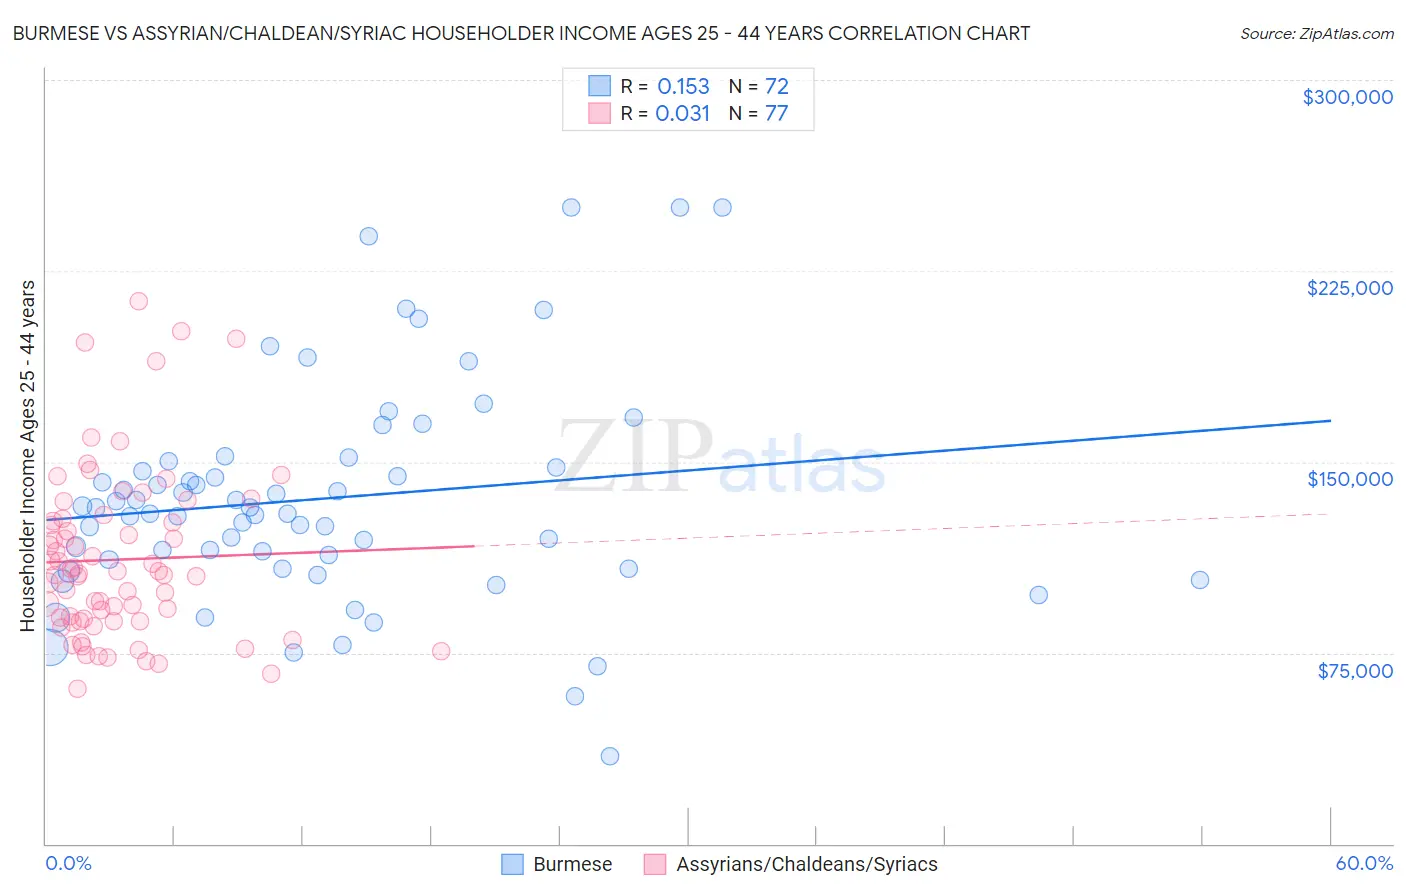
Burmese vs Assyrian/Chaldean/Syriac Householder Income Ages 25 - 44 years Correlation Chart
The statistical analysis conducted on geographies consisting of 463,720,285 people shows a poor positive correlation between the proportion of Burmese and household income with householder between the ages 25 and 44 in the United States with a correlation coefficient (R) of 0.153 and weighted average of $113,701. Similarly, the statistical analysis conducted on geographies consisting of 110,187,181 people shows no correlation between the proportion of Assyrians/Chaldeans/Syriacs and household income with householder between the ages 25 and 44 in the United States with a correlation coefficient (R) of 0.031 and weighted average of $101,936, a difference of 11.5%.
Householder Income Ages 25 - 44 years Correlation Summary
| Measurement | Burmese | Assyrian/Chaldean/Syriac |
| Minimum | $34,375 | $61,104 |
| Maximum | $250,001 | $213,081 |
| Range | $215,626 | $151,977 |
| Mean | $135,614 | $111,614 |
| Median | $130,767 | $106,222 |
| Interquartile 25% (IQ1) | $109,816 | $87,410 |
| Interquartile 75% (IQ3) | $149,069 | $127,171 |
| Interquartile Range (IQR) | $39,253 | $39,761 |
| Standard Deviation (Sample) | $43,392 | $33,046 |
| Standard Deviation (Population) | $43,090 | $32,830 |
Similar Demographics by Householder Income Ages 25 - 44 years
Demographics Similar to Burmese by Householder Income Ages 25 - 44 years
In terms of householder income ages 25 - 44 years, the demographic groups most similar to Burmese are Immigrants from Korea ($113,401, a difference of 0.26%), Eastern European ($114,523, a difference of 0.72%), Asian ($112,666, a difference of 0.92%), Immigrants from Belgium ($112,575, a difference of 1.0%), and Immigrants from Japan ($112,228, a difference of 1.3%).
| Demographics | Rating | Rank | Householder Income Ages 25 - 44 years |
| Immigrants | Iran | 100.0 /100 | #12 | Exceptional $119,204 |
| Immigrants | Eastern Asia | 100.0 /100 | #13 | Exceptional $118,056 |
| Immigrants | Israel | 100.0 /100 | #14 | Exceptional $117,219 |
| Immigrants | South Central Asia | 100.0 /100 | #15 | Exceptional $116,626 |
| Cypriots | 100.0 /100 | #16 | Exceptional $116,364 |
| Immigrants | Australia | 100.0 /100 | #17 | Exceptional $115,947 |
| Eastern Europeans | 100.0 /100 | #18 | Exceptional $114,523 |
| Burmese | 100.0 /100 | #19 | Exceptional $113,701 |
| Immigrants | Korea | 100.0 /100 | #20 | Exceptional $113,401 |
| Asians | 100.0 /100 | #21 | Exceptional $112,666 |
| Immigrants | Belgium | 100.0 /100 | #22 | Exceptional $112,575 |
| Immigrants | Japan | 100.0 /100 | #23 | Exceptional $112,228 |
| Immigrants | Sweden | 100.0 /100 | #24 | Exceptional $112,010 |
| Immigrants | Northern Europe | 100.0 /100 | #25 | Exceptional $111,676 |
| Immigrants | Asia | 100.0 /100 | #26 | Exceptional $110,787 |
Demographics Similar to Assyrians/Chaldeans/Syriacs by Householder Income Ages 25 - 44 years
In terms of householder income ages 25 - 44 years, the demographic groups most similar to Assyrians/Chaldeans/Syriacs are Sri Lankan ($101,960, a difference of 0.020%), Macedonian ($101,882, a difference of 0.050%), Immigrants from England ($102,020, a difference of 0.080%), Austrian ($101,842, a difference of 0.090%), and Immigrants from Kazakhstan ($101,727, a difference of 0.21%).
| Demographics | Rating | Rank | Householder Income Ages 25 - 44 years |
| Immigrants | Canada | 98.9 /100 | #88 | Exceptional $102,616 |
| Romanians | 98.8 /100 | #89 | Exceptional $102,544 |
| Ukrainians | 98.8 /100 | #90 | Exceptional $102,451 |
| Croatians | 98.7 /100 | #91 | Exceptional $102,414 |
| Immigrants | North America | 98.7 /100 | #92 | Exceptional $102,407 |
| Immigrants | England | 98.4 /100 | #93 | Exceptional $102,020 |
| Sri Lankans | 98.4 /100 | #94 | Exceptional $101,960 |
| Assyrians/Chaldeans/Syriacs | 98.3 /100 | #95 | Exceptional $101,936 |
| Macedonians | 98.3 /100 | #96 | Exceptional $101,882 |
| Austrians | 98.3 /100 | #97 | Exceptional $101,842 |
| Immigrants | Kazakhstan | 98.1 /100 | #98 | Exceptional $101,727 |
| Taiwanese | 97.9 /100 | #99 | Exceptional $101,492 |
| Immigrants | Argentina | 97.8 /100 | #100 | Exceptional $101,415 |
| Albanians | 97.8 /100 | #101 | Exceptional $101,367 |
| Immigrants | Lebanon | 97.4 /100 | #102 | Exceptional $101,124 |