Cypriot vs Indian (Asian) Median Household Income
COMPARE
Cypriot
Indian (Asian)
Median Household Income
Median Household Income Comparison
Cypriots
Indians (Asian)
$102,843
MEDIAN HOUSEHOLD INCOME
100.0/ 100
METRIC RATING
18th/ 347
METRIC RANK
$105,262
MEDIAN HOUSEHOLD INCOME
100.0/ 100
METRIC RATING
12th/ 347
METRIC RANK
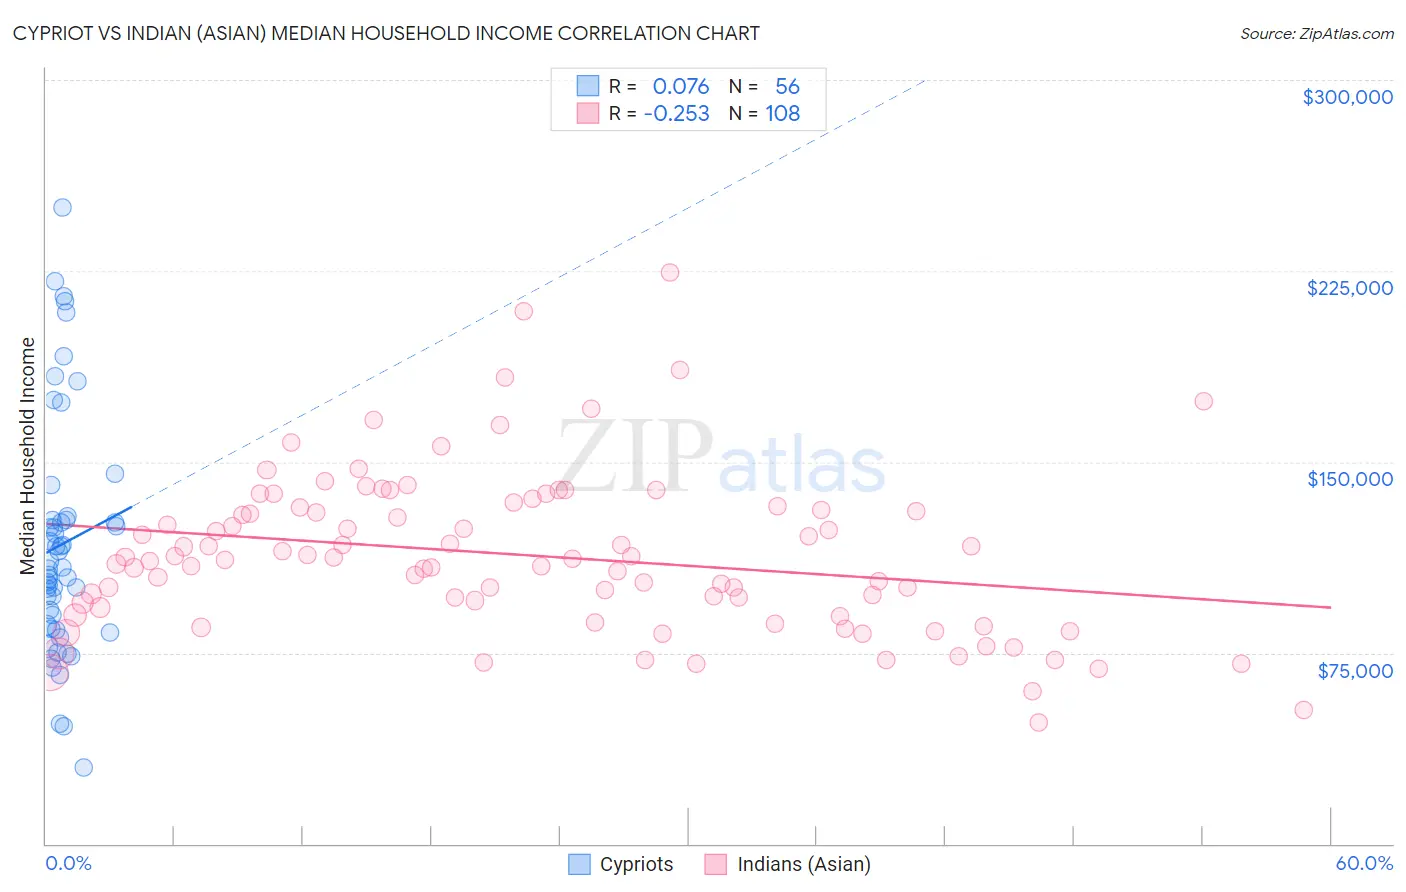
Cypriot vs Indian (Asian) Median Household Income Correlation Chart
The statistical analysis conducted on geographies consisting of 61,845,026 people shows a slight positive correlation between the proportion of Cypriots and median household income in the United States with a correlation coefficient (R) of 0.076 and weighted average of $102,843. Similarly, the statistical analysis conducted on geographies consisting of 494,532,621 people shows a weak negative correlation between the proportion of Indians (Asian) and median household income in the United States with a correlation coefficient (R) of -0.253 and weighted average of $105,262, a difference of 2.4%.
Median Household Income Correlation Summary
| Measurement | Cypriot | Indian (Asian) |
| Minimum | $30,029 | $47,386 |
| Maximum | $250,001 | $224,427 |
| Range | $219,972 | $177,041 |
| Mean | $117,612 | $113,272 |
| Median | $108,270 | $111,615 |
| Interquartile 25% (IQ1) | $84,969 | $91,317 |
| Interquartile 75% (IQ3) | $127,095 | $131,580 |
| Interquartile Range (IQR) | $42,126 | $40,263 |
| Standard Deviation (Sample) | $46,602 | $31,514 |
| Standard Deviation (Population) | $46,184 | $31,368 |
Demographics Similar to Cypriots and Indians (Asian) by Median Household Income
In terms of median household income, the demographic groups most similar to Cypriots are Immigrants from Korea ($102,962, a difference of 0.12%), Immigrants from Australia ($102,562, a difference of 0.27%), Burmese ($103,145, a difference of 0.29%), Bolivian ($102,195, a difference of 0.63%), and Eastern European ($101,781, a difference of 1.0%). Similarly, the demographic groups most similar to Indians (Asian) are Immigrants from China ($105,335, a difference of 0.070%), Immigrants from Eastern Asia ($104,796, a difference of 0.45%), Immigrants from Ireland ($104,692, a difference of 0.54%), Immigrants from South Central Asia ($106,057, a difference of 0.76%), and Immigrants from Israel ($104,090, a difference of 1.1%).
| Demographics | Rating | Rank | Median Household Income |
| Thais | 100.0 /100 | #5 | Exceptional $110,648 |
| Immigrants | Singapore | 100.0 /100 | #6 | Exceptional $110,428 |
| Iranians | 100.0 /100 | #7 | Exceptional $109,835 |
| Immigrants | Iran | 100.0 /100 | #8 | Exceptional $108,055 |
| Okinawans | 100.0 /100 | #9 | Exceptional $106,624 |
| Immigrants | South Central Asia | 100.0 /100 | #10 | Exceptional $106,057 |
| Immigrants | China | 100.0 /100 | #11 | Exceptional $105,335 |
| Indians (Asian) | 100.0 /100 | #12 | Exceptional $105,262 |
| Immigrants | Eastern Asia | 100.0 /100 | #13 | Exceptional $104,796 |
| Immigrants | Ireland | 100.0 /100 | #14 | Exceptional $104,692 |
| Immigrants | Israel | 100.0 /100 | #15 | Exceptional $104,090 |
| Burmese | 100.0 /100 | #16 | Exceptional $103,145 |
| Immigrants | Korea | 100.0 /100 | #17 | Exceptional $102,962 |
| Cypriots | 100.0 /100 | #18 | Exceptional $102,843 |
| Immigrants | Australia | 100.0 /100 | #19 | Exceptional $102,562 |
| Bolivians | 100.0 /100 | #20 | Exceptional $102,195 |
| Eastern Europeans | 100.0 /100 | #21 | Exceptional $101,781 |
| Asians | 100.0 /100 | #22 | Exceptional $101,681 |
| Immigrants | Bolivia | 100.0 /100 | #23 | Exceptional $101,394 |
| Immigrants | Japan | 100.0 /100 | #24 | Exceptional $100,711 |
| Immigrants | Sweden | 100.0 /100 | #25 | Exceptional $100,699 |