Bulgarian vs Canadian Householder Income Ages 25 - 44 years
COMPARE
Bulgarian
Canadian
Householder Income Ages 25 - 44 years
Householder Income Ages 25 - 44 years Comparison
Bulgarians
Canadians
$107,264
HOUSEHOLDER INCOME AGES 25 - 44 YEARS
99.9/ 100
METRIC RATING
48th/ 347
METRIC RANK
$97,625
HOUSEHOLDER INCOME AGES 25 - 44 YEARS
84.5/ 100
METRIC RATING
134th/ 347
METRIC RANK
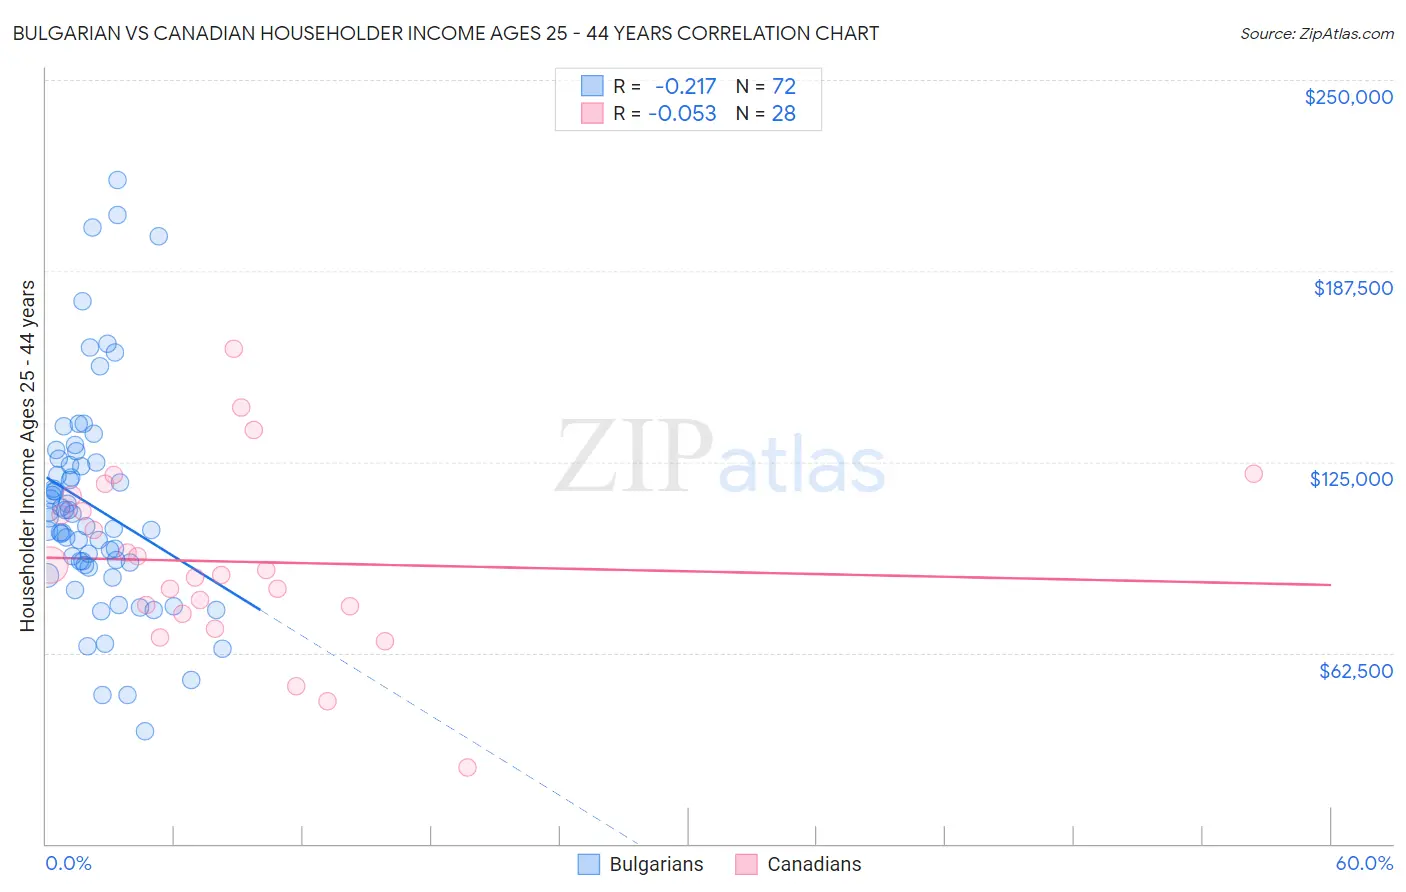
Bulgarian vs Canadian Householder Income Ages 25 - 44 years Correlation Chart
The statistical analysis conducted on geographies consisting of 205,263,192 people shows a weak negative correlation between the proportion of Bulgarians and household income with householder between the ages 25 and 44 in the United States with a correlation coefficient (R) of -0.217 and weighted average of $107,264. Similarly, the statistical analysis conducted on geographies consisting of 435,952,621 people shows a slight negative correlation between the proportion of Canadians and household income with householder between the ages 25 and 44 in the United States with a correlation coefficient (R) of -0.053 and weighted average of $97,625, a difference of 9.9%.
Householder Income Ages 25 - 44 years Correlation Summary
| Measurement | Bulgarian | Canadian |
| Minimum | $36,944 | $24,946 |
| Maximum | $217,083 | $162,133 |
| Range | $180,139 | $137,187 |
| Mean | $110,338 | $92,304 |
| Median | $105,369 | $88,643 |
| Interquartile 25% (IQ1) | $91,534 | $76,629 |
| Interquartile 75% (IQ3) | $124,530 | $111,424 |
| Interquartile Range (IQR) | $32,997 | $34,795 |
| Standard Deviation (Sample) | $35,831 | $29,698 |
| Standard Deviation (Population) | $35,581 | $29,162 |
Similar Demographics by Householder Income Ages 25 - 44 years
Demographics Similar to Bulgarians by Householder Income Ages 25 - 44 years
In terms of householder income ages 25 - 44 years, the demographic groups most similar to Bulgarians are Estonian ($107,269, a difference of 0.010%), Immigrants from Turkey ($107,258, a difference of 0.010%), Cambodian ($107,148, a difference of 0.11%), Immigrants from Belarus ($107,393, a difference of 0.12%), and Israeli ($107,579, a difference of 0.29%).
| Demographics | Rating | Rank | Householder Income Ages 25 - 44 years |
| Immigrants | Bolivia | 99.9 /100 | #41 | Exceptional $108,128 |
| Australians | 99.9 /100 | #42 | Exceptional $107,912 |
| Immigrants | Malaysia | 99.9 /100 | #43 | Exceptional $107,650 |
| Immigrants | Indonesia | 99.9 /100 | #44 | Exceptional $107,627 |
| Israelis | 99.9 /100 | #45 | Exceptional $107,579 |
| Immigrants | Belarus | 99.9 /100 | #46 | Exceptional $107,393 |
| Estonians | 99.9 /100 | #47 | Exceptional $107,269 |
| Bulgarians | 99.9 /100 | #48 | Exceptional $107,264 |
| Immigrants | Turkey | 99.9 /100 | #49 | Exceptional $107,258 |
| Cambodians | 99.9 /100 | #50 | Exceptional $107,148 |
| Immigrants | Czechoslovakia | 99.9 /100 | #51 | Exceptional $106,888 |
| Immigrants | Europe | 99.9 /100 | #52 | Exceptional $106,817 |
| Immigrants | Norway | 99.9 /100 | #53 | Exceptional $106,629 |
| Paraguayans | 99.9 /100 | #54 | Exceptional $106,615 |
| Greeks | 99.9 /100 | #55 | Exceptional $106,457 |
Demographics Similar to Canadians by Householder Income Ages 25 - 44 years
In terms of householder income ages 25 - 44 years, the demographic groups most similar to Canadians are Immigrants from Oceania ($97,623, a difference of 0.0%), Hungarian ($97,544, a difference of 0.080%), Tsimshian ($97,809, a difference of 0.19%), Immigrants from Zimbabwe ($97,880, a difference of 0.26%), and Lebanese ($97,339, a difference of 0.29%).
| Demographics | Rating | Rank | Householder Income Ages 25 - 44 years |
| Serbians | 88.9 /100 | #127 | Excellent $98,320 |
| Europeans | 88.9 /100 | #128 | Excellent $98,310 |
| Brazilians | 88.6 /100 | #129 | Excellent $98,267 |
| Immigrants | Kuwait | 87.8 /100 | #130 | Excellent $98,122 |
| Immigrants | Albania | 86.6 /100 | #131 | Excellent $97,929 |
| Immigrants | Zimbabwe | 86.3 /100 | #132 | Excellent $97,880 |
| Tsimshian | 85.8 /100 | #133 | Excellent $97,809 |
| Canadians | 84.5 /100 | #134 | Excellent $97,625 |
| Immigrants | Oceania | 84.5 /100 | #135 | Excellent $97,623 |
| Hungarians | 83.9 /100 | #136 | Excellent $97,544 |
| Lebanese | 82.3 /100 | #137 | Excellent $97,339 |
| Arabs | 82.3 /100 | #138 | Excellent $97,336 |
| Immigrants | Peru | 82.2 /100 | #139 | Excellent $97,329 |
| Immigrants | Morocco | 82.0 /100 | #140 | Excellent $97,305 |
| Luxembourgers | 81.5 /100 | #141 | Excellent $97,237 |