British vs Yup'ik Divorced or Separated
COMPARE
British
Yup'ik
Divorced or Separated
Divorced or Separated Comparison
British
Yup'ik
12.3%
DIVORCED OR SEPARATED
11.6/ 100
METRIC RATING
220th/ 347
METRIC RANK
10.3%
DIVORCED OR SEPARATED
100.0/ 100
METRIC RATING
9th/ 347
METRIC RANK
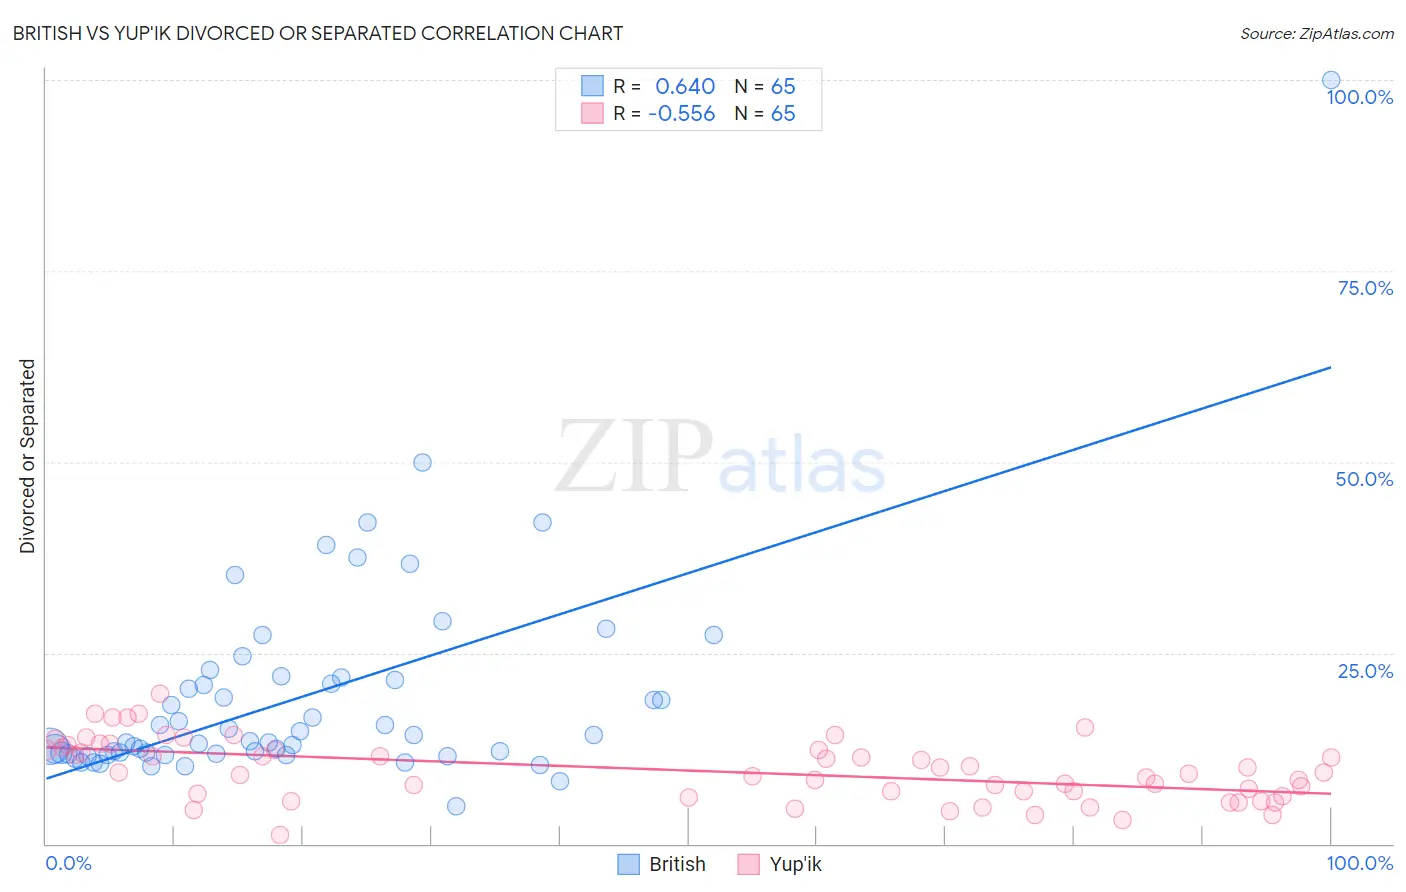
British vs Yup'ik Divorced or Separated Correlation Chart
The statistical analysis conducted on geographies consisting of 531,128,127 people shows a significant positive correlation between the proportion of British and percentage of population currently divorced or separated in the United States with a correlation coefficient (R) of 0.640 and weighted average of 12.3%. Similarly, the statistical analysis conducted on geographies consisting of 39,962,482 people shows a substantial negative correlation between the proportion of Yup'ik and percentage of population currently divorced or separated in the United States with a correlation coefficient (R) of -0.556 and weighted average of 10.3%, a difference of 19.3%.
Divorced or Separated Correlation Summary
| Measurement | British | Yup'ik |
| Minimum | 4.9% | 1.2% |
| Maximum | 100.0% | 19.7% |
| Range | 95.1% | 18.5% |
| Mean | 19.2% | 9.6% |
| Median | 13.4% | 9.3% |
| Interquartile 25% (IQ1) | 11.8% | 6.4% |
| Interquartile 75% (IQ3) | 21.6% | 12.5% |
| Interquartile Range (IQR) | 9.8% | 6.1% |
| Standard Deviation (Sample) | 13.9% | 4.0% |
| Standard Deviation (Population) | 13.8% | 4.0% |
Similar Demographics by Divorced or Separated
Demographics Similar to British by Divorced or Separated
In terms of divorced or separated, the demographic groups most similar to British are Czechoslovakian (12.3%, a difference of 0.010%), Guamanian/Chamorro (12.3%, a difference of 0.030%), Bangladeshi (12.3%, a difference of 0.10%), Scandinavian (12.3%, a difference of 0.11%), and Slovene (12.3%, a difference of 0.12%).
| Demographics | Rating | Rank | Divorced or Separated |
| Immigrants | Eastern Africa | 16.2 /100 | #213 | Poor 12.2% |
| Immigrants | Argentina | 15.5 /100 | #214 | Poor 12.2% |
| Europeans | 15.4 /100 | #215 | Poor 12.2% |
| Immigrants | South America | 15.4 /100 | #216 | Poor 12.2% |
| Northern Europeans | 14.7 /100 | #217 | Poor 12.2% |
| Slovenes | 13.2 /100 | #218 | Poor 12.3% |
| Czechoslovakians | 11.7 /100 | #219 | Poor 12.3% |
| British | 11.6 /100 | #220 | Poor 12.3% |
| Guamanians/Chamorros | 11.3 /100 | #221 | Poor 12.3% |
| Bangladeshis | 10.5 /100 | #222 | Poor 12.3% |
| Scandinavians | 10.4 /100 | #223 | Poor 12.3% |
| Immigrants | Azores | 9.7 /100 | #224 | Tragic 12.3% |
| Belgians | 9.7 /100 | #225 | Tragic 12.3% |
| Immigrants | Western Africa | 9.3 /100 | #226 | Tragic 12.3% |
| Hmong | 8.8 /100 | #227 | Tragic 12.3% |
Demographics Similar to Yup'ik by Divorced or Separated
In terms of divorced or separated, the demographic groups most similar to Yup'ik are Immigrants from Eastern Asia (10.2%, a difference of 0.44%), Immigrants from Singapore (10.3%, a difference of 0.53%), Thai (10.2%, a difference of 0.78%), Indian (Asian) (10.2%, a difference of 0.83%), and Immigrants from South Central Asia (10.4%, a difference of 1.5%).
| Demographics | Rating | Rank | Divorced or Separated |
| Filipinos | 100.0 /100 | #2 | Exceptional 9.9% |
| Immigrants | Hong Kong | 100.0 /100 | #3 | Exceptional 10.0% |
| Immigrants | China | 100.0 /100 | #4 | Exceptional 10.0% |
| Immigrants | India | 100.0 /100 | #5 | Exceptional 10.1% |
| Indians (Asian) | 100.0 /100 | #6 | Exceptional 10.2% |
| Thais | 100.0 /100 | #7 | Exceptional 10.2% |
| Immigrants | Eastern Asia | 100.0 /100 | #8 | Exceptional 10.2% |
| Yup'ik | 100.0 /100 | #9 | Exceptional 10.3% |
| Immigrants | Singapore | 100.0 /100 | #10 | Exceptional 10.3% |
| Immigrants | South Central Asia | 100.0 /100 | #11 | Exceptional 10.4% |
| Okinawans | 100.0 /100 | #12 | Exceptional 10.5% |
| Cypriots | 100.0 /100 | #13 | Exceptional 10.5% |
| Assyrians/Chaldeans/Syriacs | 100.0 /100 | #14 | Exceptional 10.6% |
| Immigrants | Armenia | 100.0 /100 | #15 | Exceptional 10.6% |
| Immigrants | Korea | 100.0 /100 | #16 | Exceptional 10.6% |