Immigrants from Uzbekistan vs Tlingit-Haida Householder Income Over 65 years
COMPARE
Immigrants from Uzbekistan
Tlingit-Haida
Householder Income Over 65 years
Householder Income Over 65 years Comparison
Immigrants from Uzbekistan
Tlingit-Haida
$56,331
HOUSEHOLDER INCOME OVER 65 YEARS
0.8/ 100
METRIC RATING
245th/ 347
METRIC RANK
$62,922
HOUSEHOLDER INCOME OVER 65 YEARS
88.6/ 100
METRIC RATING
123rd/ 347
METRIC RANK
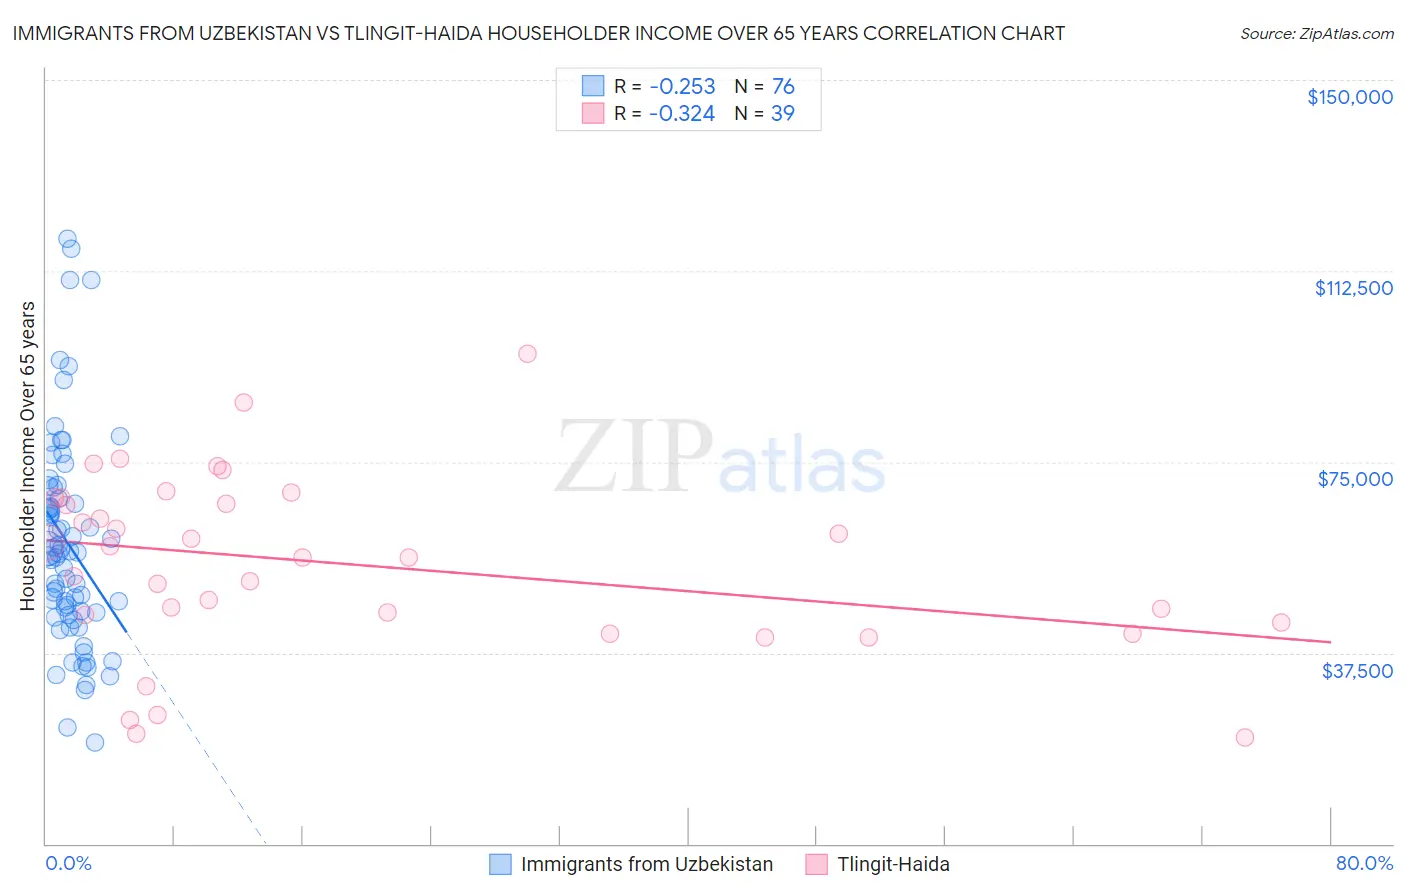
Immigrants from Uzbekistan vs Tlingit-Haida Householder Income Over 65 years Correlation Chart
The statistical analysis conducted on geographies consisting of 118,494,051 people shows a weak negative correlation between the proportion of Immigrants from Uzbekistan and household income with householder over the age of 65 in the United States with a correlation coefficient (R) of -0.253 and weighted average of $56,331. Similarly, the statistical analysis conducted on geographies consisting of 60,750,081 people shows a mild negative correlation between the proportion of Tlingit-Haida and household income with householder over the age of 65 in the United States with a correlation coefficient (R) of -0.324 and weighted average of $62,922, a difference of 11.7%.
Householder Income Over 65 years Correlation Summary
| Measurement | Immigrants from Uzbekistan | Tlingit-Haida |
| Minimum | $19,854 | $20,833 |
| Maximum | $118,913 | $96,250 |
| Range | $99,059 | $75,417 |
| Mean | $58,777 | $54,963 |
| Median | $57,095 | $56,173 |
| Interquartile 25% (IQ1) | $45,204 | $43,571 |
| Interquartile 75% (IQ3) | $68,803 | $67,937 |
| Interquartile Range (IQR) | $23,599 | $24,366 |
| Standard Deviation (Sample) | $20,801 | $17,428 |
| Standard Deviation (Population) | $20,663 | $17,203 |
Similar Demographics by Householder Income Over 65 years
Demographics Similar to Immigrants from Uzbekistan by Householder Income Over 65 years
In terms of householder income over 65 years, the demographic groups most similar to Immigrants from Uzbekistan are Hmong ($56,339, a difference of 0.020%), Central American ($56,321, a difference of 0.020%), Guyanese ($56,351, a difference of 0.040%), Yaqui ($56,417, a difference of 0.15%), and Yakama ($56,234, a difference of 0.17%).
| Demographics | Rating | Rank | Householder Income Over 65 years |
| Fijians | 1.2 /100 | #238 | Tragic $56,768 |
| Immigrants | Laos | 1.2 /100 | #239 | Tragic $56,722 |
| Sub-Saharan Africans | 1.0 /100 | #240 | Tragic $56,615 |
| Immigrants | Guyana | 0.9 /100 | #241 | Tragic $56,495 |
| Yaqui | 0.8 /100 | #242 | Tragic $56,417 |
| Guyanese | 0.8 /100 | #243 | Tragic $56,351 |
| Hmong | 0.8 /100 | #244 | Tragic $56,339 |
| Immigrants | Uzbekistan | 0.8 /100 | #245 | Tragic $56,331 |
| Central Americans | 0.8 /100 | #246 | Tragic $56,321 |
| Yakama | 0.7 /100 | #247 | Tragic $56,234 |
| Vietnamese | 0.6 /100 | #248 | Tragic $56,143 |
| Mexican American Indians | 0.6 /100 | #249 | Tragic $56,089 |
| Immigrants | Bosnia and Herzegovina | 0.5 /100 | #250 | Tragic $55,986 |
| Immigrants | Portugal | 0.5 /100 | #251 | Tragic $55,924 |
| Osage | 0.4 /100 | #252 | Tragic $55,677 |
Demographics Similar to Tlingit-Haida by Householder Income Over 65 years
In terms of householder income over 65 years, the demographic groups most similar to Tlingit-Haida are Immigrants from Moldova ($62,939, a difference of 0.030%), Taiwanese ($62,894, a difference of 0.040%), Soviet Union ($62,848, a difference of 0.12%), Immigrants from Vietnam ($63,014, a difference of 0.15%), and Ukrainian ($63,032, a difference of 0.18%).
| Demographics | Rating | Rank | Householder Income Over 65 years |
| Guamanians/Chamorros | 91.1 /100 | #116 | Exceptional $63,187 |
| Immigrants | Croatia | 90.9 /100 | #117 | Exceptional $63,168 |
| Danes | 90.5 /100 | #118 | Exceptional $63,117 |
| Immigrants | Jordan | 89.8 /100 | #119 | Excellent $63,041 |
| Ukrainians | 89.7 /100 | #120 | Excellent $63,032 |
| Immigrants | Vietnam | 89.5 /100 | #121 | Excellent $63,014 |
| Immigrants | Moldova | 88.7 /100 | #122 | Excellent $62,939 |
| Tlingit-Haida | 88.6 /100 | #123 | Excellent $62,922 |
| Taiwanese | 88.3 /100 | #124 | Excellent $62,894 |
| Soviet Union | 87.8 /100 | #125 | Excellent $62,848 |
| Peruvians | 86.8 /100 | #126 | Excellent $62,766 |
| Swedes | 86.4 /100 | #127 | Excellent $62,736 |
| Aleuts | 86.1 /100 | #128 | Excellent $62,708 |
| Immigrants | Eastern Europe | 85.9 /100 | #129 | Excellent $62,693 |
| Basques | 85.4 /100 | #130 | Excellent $62,653 |