Brazilian vs Tlingit-Haida Householder Income Over 65 years
COMPARE
Brazilian
Tlingit-Haida
Householder Income Over 65 years
Householder Income Over 65 years Comparison
Brazilians
Tlingit-Haida
$61,465
HOUSEHOLDER INCOME OVER 65 YEARS
62.7/ 100
METRIC RATING
159th/ 347
METRIC RANK
$62,922
HOUSEHOLDER INCOME OVER 65 YEARS
88.6/ 100
METRIC RATING
123rd/ 347
METRIC RANK
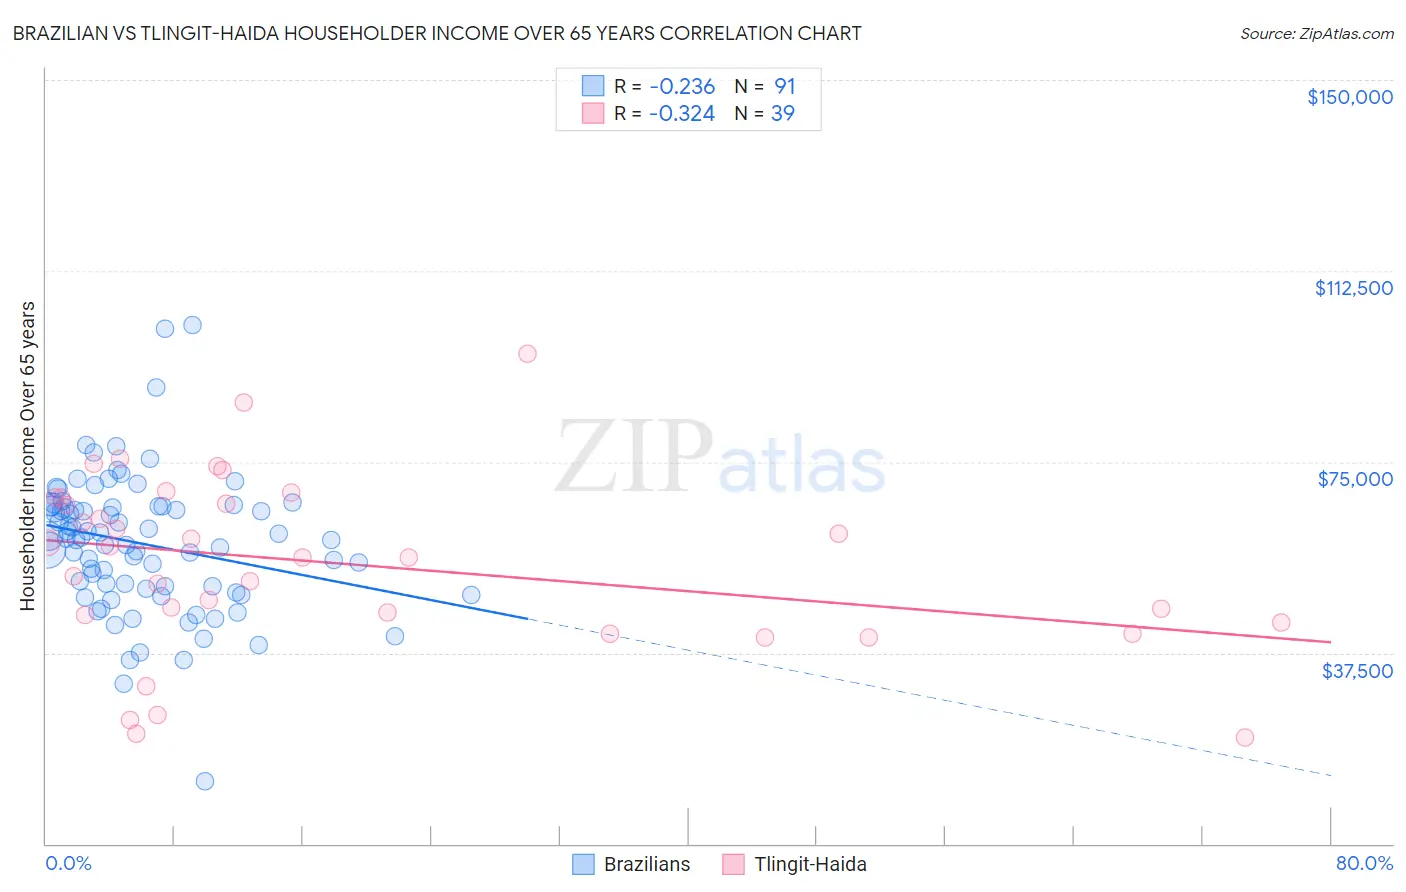
Brazilian vs Tlingit-Haida Householder Income Over 65 years Correlation Chart
The statistical analysis conducted on geographies consisting of 322,898,345 people shows a weak negative correlation between the proportion of Brazilians and household income with householder over the age of 65 in the United States with a correlation coefficient (R) of -0.236 and weighted average of $61,465. Similarly, the statistical analysis conducted on geographies consisting of 60,750,081 people shows a mild negative correlation between the proportion of Tlingit-Haida and household income with householder over the age of 65 in the United States with a correlation coefficient (R) of -0.324 and weighted average of $62,922, a difference of 2.4%.
Householder Income Over 65 years Correlation Summary
| Measurement | Brazilian | Tlingit-Haida |
| Minimum | $12,293 | $20,833 |
| Maximum | $101,779 | $96,250 |
| Range | $89,486 | $75,417 |
| Mean | $58,895 | $54,963 |
| Median | $60,037 | $56,173 |
| Interquartile 25% (IQ1) | $50,127 | $43,571 |
| Interquartile 75% (IQ3) | $66,316 | $67,937 |
| Interquartile Range (IQR) | $16,189 | $24,366 |
| Standard Deviation (Sample) | $13,580 | $17,428 |
| Standard Deviation (Population) | $13,505 | $17,203 |
Similar Demographics by Householder Income Over 65 years
Demographics Similar to Brazilians by Householder Income Over 65 years
In terms of householder income over 65 years, the demographic groups most similar to Brazilians are English ($61,487, a difference of 0.040%), Portuguese ($61,440, a difference of 0.040%), Macedonian ($61,564, a difference of 0.16%), Scandinavian ($61,586, a difference of 0.20%), and Polish ($61,598, a difference of 0.22%).
| Demographics | Rating | Rank | Householder Income Over 65 years |
| Armenians | 67.3 /100 | #152 | Good $61,656 |
| Costa Ricans | 66.9 /100 | #153 | Good $61,638 |
| Swiss | 66.5 /100 | #154 | Good $61,621 |
| Poles | 65.9 /100 | #155 | Good $61,598 |
| Scandinavians | 65.6 /100 | #156 | Good $61,586 |
| Macedonians | 65.1 /100 | #157 | Good $61,564 |
| English | 63.3 /100 | #158 | Good $61,487 |
| Brazilians | 62.7 /100 | #159 | Good $61,465 |
| Portuguese | 62.1 /100 | #160 | Good $61,440 |
| Icelanders | 57.9 /100 | #161 | Average $61,270 |
| Czechs | 57.2 /100 | #162 | Average $61,244 |
| Ugandans | 55.5 /100 | #163 | Average $61,177 |
| Immigrants | North Macedonia | 55.4 /100 | #164 | Average $61,175 |
| Immigrants | Ukraine | 55.1 /100 | #165 | Average $61,163 |
| Immigrants | Eastern Africa | 55.0 /100 | #166 | Average $61,157 |
Demographics Similar to Tlingit-Haida by Householder Income Over 65 years
In terms of householder income over 65 years, the demographic groups most similar to Tlingit-Haida are Immigrants from Moldova ($62,939, a difference of 0.030%), Taiwanese ($62,894, a difference of 0.040%), Soviet Union ($62,848, a difference of 0.12%), Immigrants from Vietnam ($63,014, a difference of 0.15%), and Ukrainian ($63,032, a difference of 0.18%).
| Demographics | Rating | Rank | Householder Income Over 65 years |
| Guamanians/Chamorros | 91.1 /100 | #116 | Exceptional $63,187 |
| Immigrants | Croatia | 90.9 /100 | #117 | Exceptional $63,168 |
| Danes | 90.5 /100 | #118 | Exceptional $63,117 |
| Immigrants | Jordan | 89.8 /100 | #119 | Excellent $63,041 |
| Ukrainians | 89.7 /100 | #120 | Excellent $63,032 |
| Immigrants | Vietnam | 89.5 /100 | #121 | Excellent $63,014 |
| Immigrants | Moldova | 88.7 /100 | #122 | Excellent $62,939 |
| Tlingit-Haida | 88.6 /100 | #123 | Excellent $62,922 |
| Taiwanese | 88.3 /100 | #124 | Excellent $62,894 |
| Soviet Union | 87.8 /100 | #125 | Excellent $62,848 |
| Peruvians | 86.8 /100 | #126 | Excellent $62,766 |
| Swedes | 86.4 /100 | #127 | Excellent $62,736 |
| Aleuts | 86.1 /100 | #128 | Excellent $62,708 |
| Immigrants | Eastern Europe | 85.9 /100 | #129 | Excellent $62,693 |
| Basques | 85.4 /100 | #130 | Excellent $62,653 |