Brazilian vs Yup'ik Householder Income Over 65 years
COMPARE
Brazilian
Yup'ik
Householder Income Over 65 years
Householder Income Over 65 years Comparison
Brazilians
Yup'ik
$61,465
HOUSEHOLDER INCOME OVER 65 YEARS
62.7/ 100
METRIC RATING
159th/ 347
METRIC RANK
$60,727
HOUSEHOLDER INCOME OVER 65 YEARS
43.7/ 100
METRIC RATING
178th/ 347
METRIC RANK
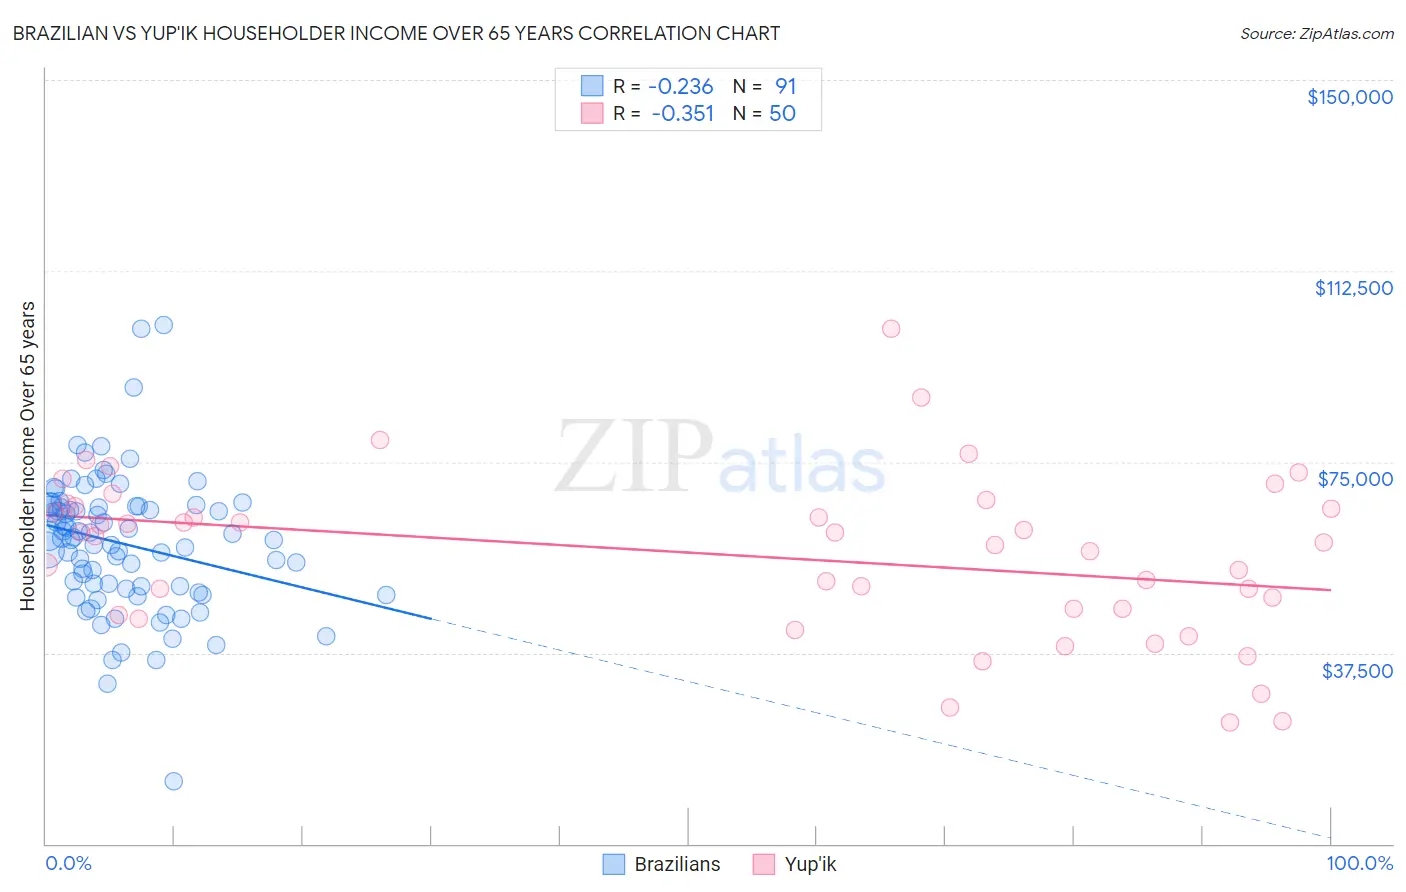
Brazilian vs Yup'ik Householder Income Over 65 years Correlation Chart
The statistical analysis conducted on geographies consisting of 322,898,345 people shows a weak negative correlation between the proportion of Brazilians and household income with householder over the age of 65 in the United States with a correlation coefficient (R) of -0.236 and weighted average of $61,465. Similarly, the statistical analysis conducted on geographies consisting of 39,903,450 people shows a mild negative correlation between the proportion of Yup'ik and household income with householder over the age of 65 in the United States with a correlation coefficient (R) of -0.351 and weighted average of $60,727, a difference of 1.2%.
Householder Income Over 65 years Correlation Summary
| Measurement | Brazilian | Yup'ik |
| Minimum | $12,293 | $23,750 |
| Maximum | $101,779 | $101,250 |
| Range | $89,486 | $77,500 |
| Mean | $58,895 | $56,793 |
| Median | $60,037 | $59,737 |
| Interquartile 25% (IQ1) | $50,127 | $46,250 |
| Interquartile 75% (IQ3) | $66,316 | $66,275 |
| Interquartile Range (IQR) | $16,189 | $20,025 |
| Standard Deviation (Sample) | $13,580 | $16,060 |
| Standard Deviation (Population) | $13,505 | $15,898 |
Demographics Similar to Brazilians and Yup'ik by Householder Income Over 65 years
In terms of householder income over 65 years, the demographic groups most similar to Brazilians are English ($61,487, a difference of 0.040%), Portuguese ($61,440, a difference of 0.040%), Icelander ($61,270, a difference of 0.32%), Czech ($61,244, a difference of 0.36%), and Ugandan ($61,177, a difference of 0.47%). Similarly, the demographic groups most similar to Yup'ik are Alaska Native ($60,748, a difference of 0.030%), Spanish ($60,795, a difference of 0.11%), Spaniard ($60,866, a difference of 0.23%), Luxembourger ($60,967, a difference of 0.40%), and Immigrants from Micronesia ($61,000, a difference of 0.45%).
| Demographics | Rating | Rank | Householder Income Over 65 years |
| English | 63.3 /100 | #158 | Good $61,487 |
| Brazilians | 62.7 /100 | #159 | Good $61,465 |
| Portuguese | 62.1 /100 | #160 | Good $61,440 |
| Icelanders | 57.9 /100 | #161 | Average $61,270 |
| Czechs | 57.2 /100 | #162 | Average $61,244 |
| Ugandans | 55.5 /100 | #163 | Average $61,177 |
| Immigrants | North Macedonia | 55.4 /100 | #164 | Average $61,175 |
| Immigrants | Ukraine | 55.1 /100 | #165 | Average $61,163 |
| Immigrants | Eastern Africa | 55.0 /100 | #166 | Average $61,157 |
| Norwegians | 53.6 /100 | #167 | Average $61,104 |
| Irish | 53.4 /100 | #168 | Average $61,097 |
| Carpatho Rusyns | 53.3 /100 | #169 | Average $61,093 |
| Serbians | 53.1 /100 | #170 | Average $61,087 |
| Inupiat | 52.4 /100 | #171 | Average $61,061 |
| Immigrants | Poland | 51.9 /100 | #172 | Average $61,041 |
| Immigrants | Micronesia | 50.8 /100 | #173 | Average $61,000 |
| Luxembourgers | 50.0 /100 | #174 | Average $60,967 |
| Spaniards | 47.3 /100 | #175 | Average $60,866 |
| Spanish | 45.5 /100 | #176 | Average $60,795 |
| Alaska Natives | 44.3 /100 | #177 | Average $60,748 |
| Yup'ik | 43.7 /100 | #178 | Average $60,727 |