Brazilian vs Yup'ik Unemployment Among Ages 25 to 29 years
COMPARE
Brazilian
Yup'ik
Unemployment Among Ages 25 to 29 years
Unemployment Among Ages 25 to 29 years Comparison
Brazilians
Yup'ik
6.5%
UNEMPLOYMENT AMONG AGES 25 TO 29 YEARS
81.9/ 100
METRIC RATING
126th/ 347
METRIC RANK
17.9%
UNEMPLOYMENT AMONG AGES 25 TO 29 YEARS
0.0/ 100
METRIC RATING
347th/ 347
METRIC RANK
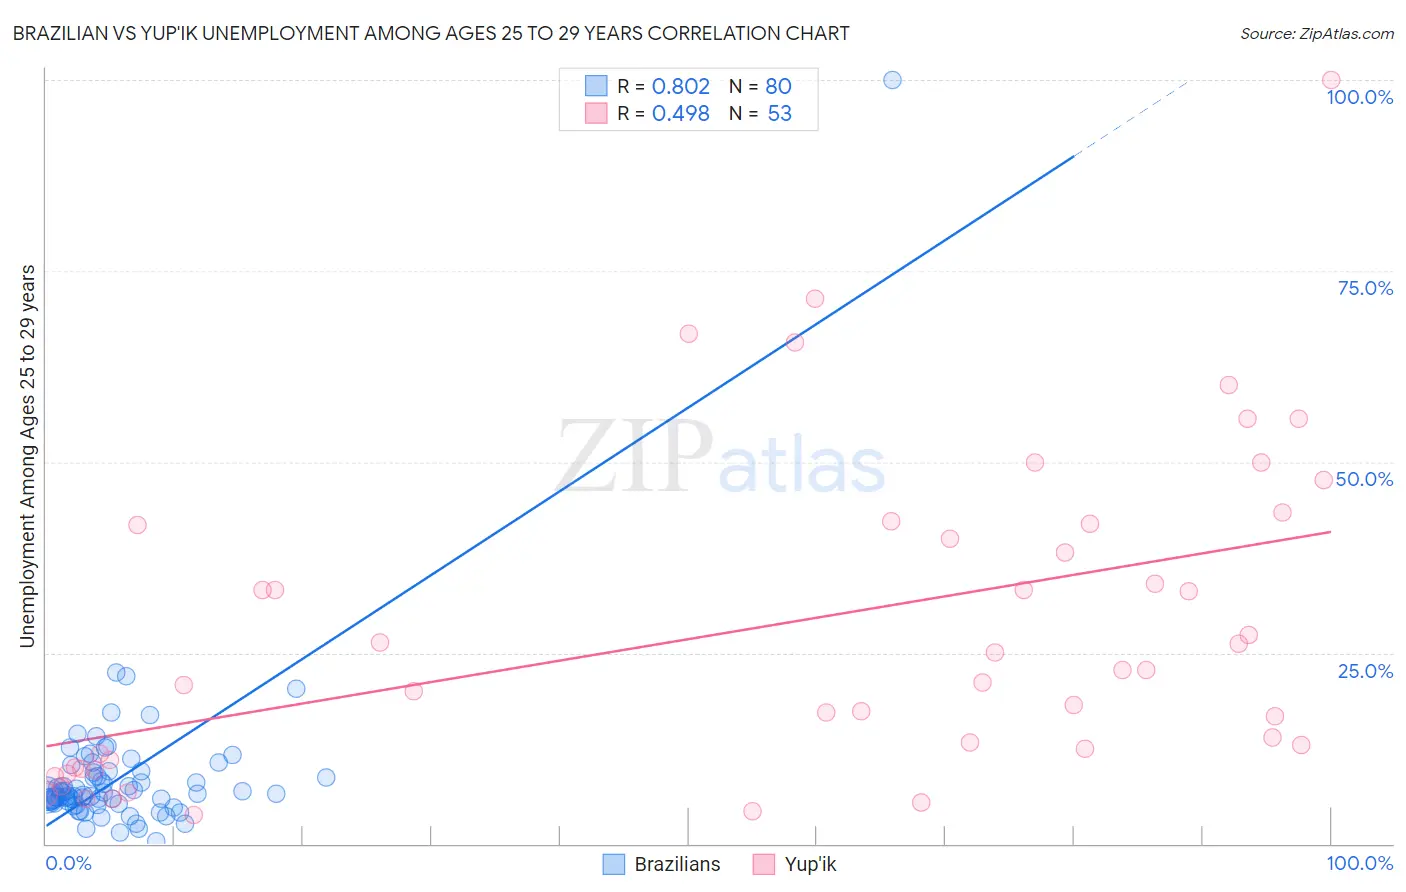
Brazilian vs Yup'ik Unemployment Among Ages 25 to 29 years Correlation Chart
The statistical analysis conducted on geographies consisting of 311,458,460 people shows a very strong positive correlation between the proportion of Brazilians and unemployment rate among population between the ages 25 and 29 in the United States with a correlation coefficient (R) of 0.802 and weighted average of 6.5%. Similarly, the statistical analysis conducted on geographies consisting of 39,381,605 people shows a moderate positive correlation between the proportion of Yup'ik and unemployment rate among population between the ages 25 and 29 in the United States with a correlation coefficient (R) of 0.498 and weighted average of 17.9%, a difference of 175.9%.
Unemployment Among Ages 25 to 29 years Correlation Summary
| Measurement | Brazilian | Yup'ik |
| Minimum | 0.40% | 3.8% |
| Maximum | 100.0% | 100.0% |
| Range | 99.6% | 96.2% |
| Mean | 8.8% | 28.1% |
| Median | 6.5% | 22.7% |
| Interquartile 25% (IQ1) | 5.4% | 10.5% |
| Interquartile 75% (IQ3) | 9.5% | 41.8% |
| Interquartile Range (IQR) | 4.0% | 31.3% |
| Standard Deviation (Sample) | 11.2% | 21.0% |
| Standard Deviation (Population) | 11.1% | 20.8% |
Similar Demographics by Unemployment Among Ages 25 to 29 years
Demographics Similar to Brazilians by Unemployment Among Ages 25 to 29 years
In terms of unemployment among ages 25 to 29 years, the demographic groups most similar to Brazilians are Syrian (6.5%, a difference of 0.020%), Arab (6.5%, a difference of 0.060%), Dutch (6.5%, a difference of 0.13%), Immigrants from Chile (6.5%, a difference of 0.15%), and Sri Lankan (6.5%, a difference of 0.17%).
| Demographics | Rating | Rank | Unemployment Among Ages 25 to 29 years |
| Immigrants | South Africa | 84.9 /100 | #119 | Excellent 6.5% |
| Immigrants | Moldova | 84.5 /100 | #120 | Excellent 6.5% |
| Immigrants | Uganda | 84.5 /100 | #121 | Excellent 6.5% |
| Immigrants | Belarus | 83.7 /100 | #122 | Excellent 6.5% |
| Laotians | 83.6 /100 | #123 | Excellent 6.5% |
| Arabs | 82.5 /100 | #124 | Excellent 6.5% |
| Syrians | 82.1 /100 | #125 | Excellent 6.5% |
| Brazilians | 81.9 /100 | #126 | Excellent 6.5% |
| Dutch | 80.6 /100 | #127 | Excellent 6.5% |
| Immigrants | Chile | 80.5 /100 | #128 | Excellent 6.5% |
| Sri Lankans | 80.3 /100 | #129 | Excellent 6.5% |
| Immigrants | Peru | 79.9 /100 | #130 | Good 6.5% |
| Immigrants | Afghanistan | 79.2 /100 | #131 | Good 6.5% |
| Poles | 76.6 /100 | #132 | Good 6.5% |
| Immigrants | Europe | 75.7 /100 | #133 | Good 6.5% |
Demographics Similar to Yup'ik by Unemployment Among Ages 25 to 29 years
In terms of unemployment among ages 25 to 29 years, the demographic groups most similar to Yup'ik are Crow (15.4%, a difference of 16.6%), Arapaho (15.4%, a difference of 16.6%), Hopi (13.5%, a difference of 32.6%), Inupiat (13.4%, a difference of 33.4%), and Navajo (12.2%, a difference of 47.2%).
| Demographics | Rating | Rank | Unemployment Among Ages 25 to 29 years |
| Alaskan Athabascans | 0.0 /100 | #333 | Tragic 10.8% |
| Yuman | 0.0 /100 | #334 | Tragic 11.0% |
| Puerto Ricans | 0.0 /100 | #335 | Tragic 11.1% |
| Lumbee | 0.0 /100 | #336 | Tragic 11.2% |
| Menominee | 0.0 /100 | #337 | Tragic 11.3% |
| Sioux | 0.0 /100 | #338 | Tragic 11.7% |
| Pima | 0.0 /100 | #339 | Tragic 11.8% |
| Cheyenne | 0.0 /100 | #340 | Tragic 11.8% |
| Tohono O'odham | 0.0 /100 | #341 | Tragic 12.1% |
| Navajo | 0.0 /100 | #342 | Tragic 12.2% |
| Inupiat | 0.0 /100 | #343 | Tragic 13.4% |
| Hopi | 0.0 /100 | #344 | Tragic 13.5% |
| Arapaho | 0.0 /100 | #345 | Tragic 15.4% |
| Crow | 0.0 /100 | #346 | Tragic 15.4% |
| Yup'ik | 0.0 /100 | #347 | Tragic 17.9% |