Kenyan vs Yup'ik Householder Income Over 65 years
COMPARE
Kenyan
Yup'ik
Householder Income Over 65 years
Householder Income Over 65 years Comparison
Kenyans
Yup'ik
$60,514
HOUSEHOLDER INCOME OVER 65 YEARS
38.4/ 100
METRIC RATING
183rd/ 347
METRIC RANK
$60,727
HOUSEHOLDER INCOME OVER 65 YEARS
43.7/ 100
METRIC RATING
178th/ 347
METRIC RANK
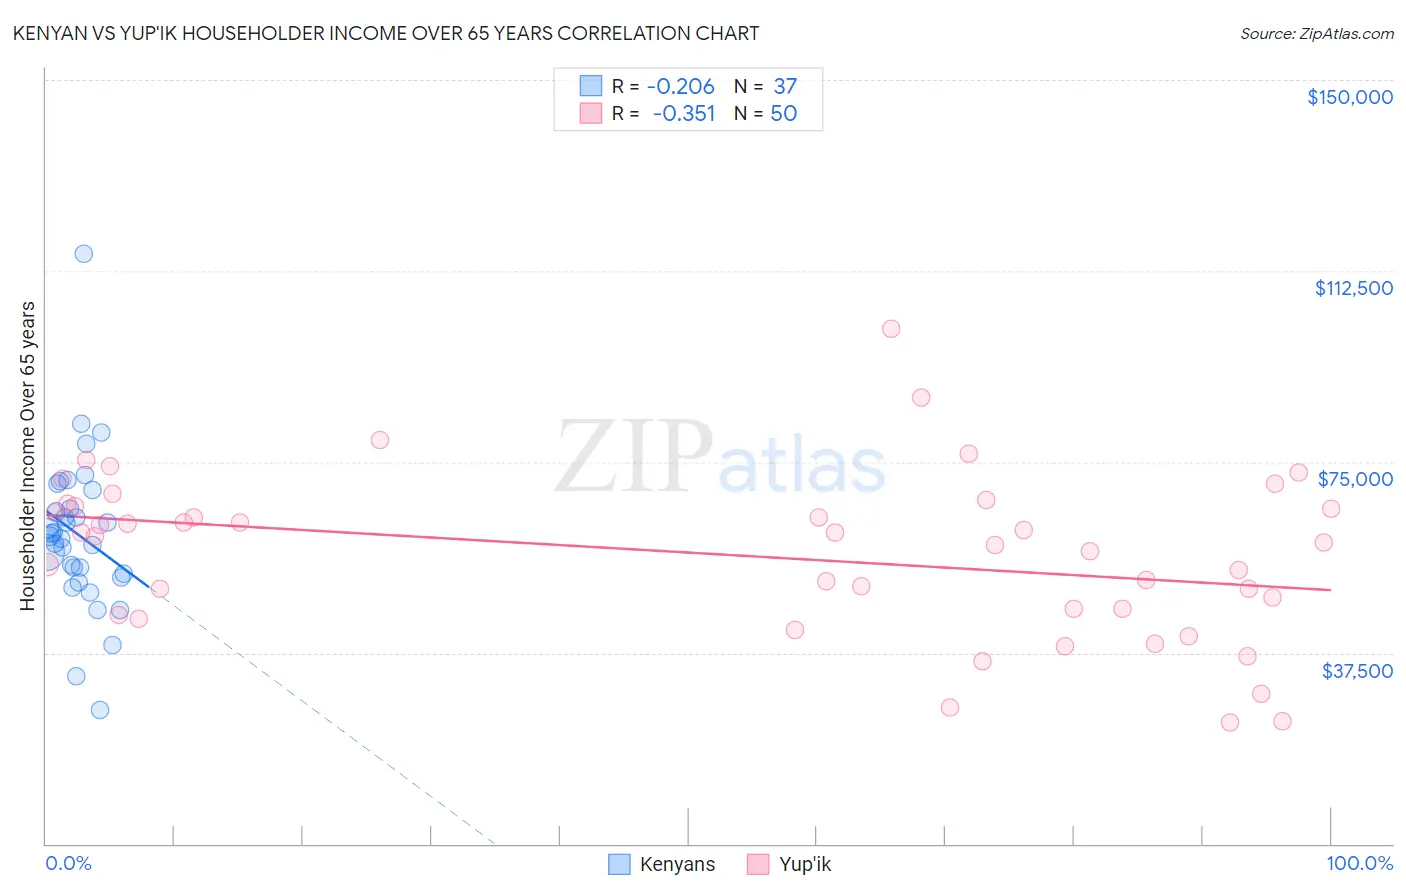
Kenyan vs Yup'ik Householder Income Over 65 years Correlation Chart
The statistical analysis conducted on geographies consisting of 167,861,948 people shows a weak negative correlation between the proportion of Kenyans and household income with householder over the age of 65 in the United States with a correlation coefficient (R) of -0.206 and weighted average of $60,514. Similarly, the statistical analysis conducted on geographies consisting of 39,903,450 people shows a mild negative correlation between the proportion of Yup'ik and household income with householder over the age of 65 in the United States with a correlation coefficient (R) of -0.351 and weighted average of $60,727, a difference of 0.35%.
Householder Income Over 65 years Correlation Summary
| Measurement | Kenyan | Yup'ik |
| Minimum | $26,155 | $23,750 |
| Maximum | $115,950 | $101,250 |
| Range | $89,795 | $77,500 |
| Mean | $60,697 | $56,793 |
| Median | $60,482 | $59,737 |
| Interquartile 25% (IQ1) | $52,723 | $46,250 |
| Interquartile 75% (IQ3) | $67,615 | $66,275 |
| Interquartile Range (IQR) | $14,892 | $20,025 |
| Standard Deviation (Sample) | $15,220 | $16,060 |
| Standard Deviation (Population) | $15,013 | $15,898 |
Demographics Similar to Kenyans and Yup'ik by Householder Income Over 65 years
In terms of householder income over 65 years, the demographic groups most similar to Kenyans are Iraqi ($60,466, a difference of 0.080%), Czechoslovakian ($60,581, a difference of 0.11%), Celtic ($60,608, a difference of 0.15%), Immigrants from Morocco ($60,647, a difference of 0.22%), and Welsh ($60,666, a difference of 0.25%). Similarly, the demographic groups most similar to Yup'ik are Alaska Native ($60,748, a difference of 0.030%), Welsh ($60,666, a difference of 0.10%), Spanish ($60,795, a difference of 0.11%), Immigrants from Morocco ($60,647, a difference of 0.13%), and Celtic ($60,608, a difference of 0.20%).
| Demographics | Rating | Rank | Householder Income Over 65 years |
| Serbians | 53.1 /100 | #170 | Average $61,087 |
| Inupiat | 52.4 /100 | #171 | Average $61,061 |
| Immigrants | Poland | 51.9 /100 | #172 | Average $61,041 |
| Immigrants | Micronesia | 50.8 /100 | #173 | Average $61,000 |
| Luxembourgers | 50.0 /100 | #174 | Average $60,967 |
| Spaniards | 47.3 /100 | #175 | Average $60,866 |
| Spanish | 45.5 /100 | #176 | Average $60,795 |
| Alaska Natives | 44.3 /100 | #177 | Average $60,748 |
| Yup'ik | 43.7 /100 | #178 | Average $60,727 |
| Welsh | 42.2 /100 | #179 | Average $60,666 |
| Immigrants | Morocco | 41.7 /100 | #180 | Average $60,647 |
| Celtics | 40.7 /100 | #181 | Average $60,608 |
| Czechoslovakians | 40.0 /100 | #182 | Average $60,581 |
| Kenyans | 38.4 /100 | #183 | Fair $60,514 |
| Iraqis | 37.2 /100 | #184 | Fair $60,466 |
| Albanians | 32.0 /100 | #185 | Fair $60,249 |
| Slovenes | 31.8 /100 | #186 | Fair $60,241 |
| Immigrants | Thailand | 31.3 /100 | #187 | Fair $60,217 |
| Immigrants | Eritrea | 28.6 /100 | #188 | Fair $60,096 |
| Ghanaians | 27.5 /100 | #189 | Fair $60,043 |
| Puget Sound Salish | 25.3 /100 | #190 | Fair $59,934 |