Brazilian vs Yup'ik Female Disability
COMPARE
Brazilian
Yup'ik
Female Disability
Female Disability Comparison
Brazilians
Yup'ik
11.8%
FEMALE DISABILITY
97.7/ 100
METRIC RATING
115th/ 347
METRIC RANK
11.6%
FEMALE DISABILITY
99.5/ 100
METRIC RATING
88th/ 347
METRIC RANK
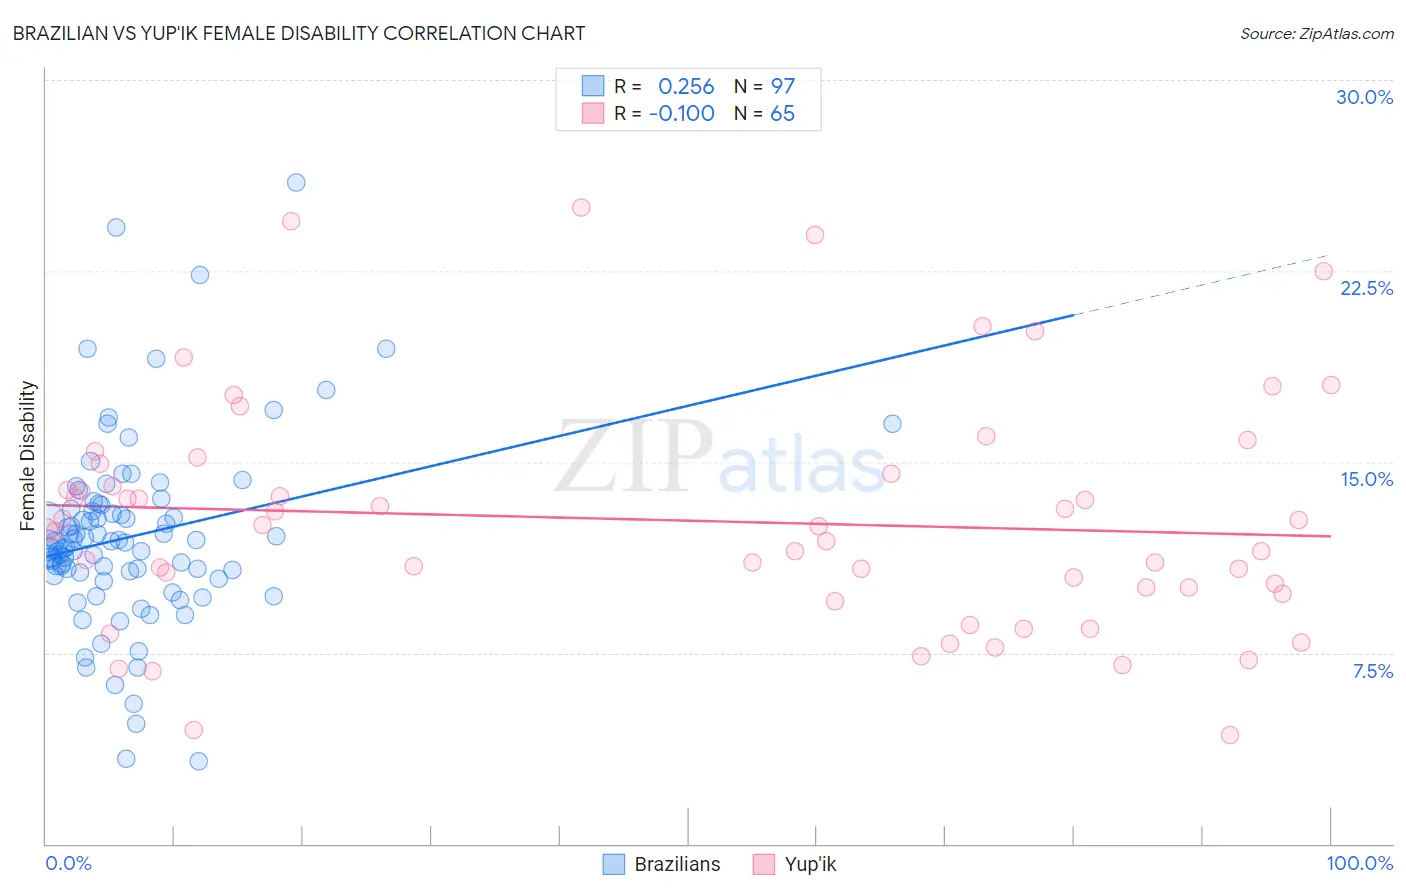
Brazilian vs Yup'ik Female Disability Correlation Chart
The statistical analysis conducted on geographies consisting of 323,948,952 people shows a weak positive correlation between the proportion of Brazilians and percentage of females with a disability in the United States with a correlation coefficient (R) of 0.256 and weighted average of 11.8%. Similarly, the statistical analysis conducted on geographies consisting of 39,957,133 people shows a slight negative correlation between the proportion of Yup'ik and percentage of females with a disability in the United States with a correlation coefficient (R) of -0.100 and weighted average of 11.6%, a difference of 1.6%.
Female Disability Correlation Summary
| Measurement | Brazilian | Yup'ik |
| Minimum | 3.2% | 4.3% |
| Maximum | 26.0% | 25.0% |
| Range | 22.7% | 20.7% |
| Mean | 12.1% | 12.7% |
| Median | 11.8% | 12.3% |
| Interquartile 25% (IQ1) | 10.6% | 9.9% |
| Interquartile 75% (IQ3) | 13.2% | 14.7% |
| Interquartile Range (IQR) | 2.6% | 4.8% |
| Standard Deviation (Sample) | 3.7% | 4.6% |
| Standard Deviation (Population) | 3.7% | 4.5% |
Similar Demographics by Female Disability
Demographics Similar to Brazilians by Female Disability
In terms of female disability, the demographic groups most similar to Brazilians are South African (11.8%, a difference of 0.0%), Immigrants from Belarus (11.8%, a difference of 0.030%), Immigrants from Bangladesh (11.8%, a difference of 0.040%), Immigrants from Morocco (11.8%, a difference of 0.040%), and Costa Rican (11.7%, a difference of 0.16%).
| Demographics | Rating | Rank | Female Disability |
| New Zealanders | 98.1 /100 | #108 | Exceptional 11.7% |
| Immigrants | Immigrants | 98.1 /100 | #109 | Exceptional 11.7% |
| Soviet Union | 98.1 /100 | #110 | Exceptional 11.7% |
| Costa Ricans | 98.1 /100 | #111 | Exceptional 11.7% |
| Immigrants | Bangladesh | 97.8 /100 | #112 | Exceptional 11.8% |
| Immigrants | Belarus | 97.8 /100 | #113 | Exceptional 11.8% |
| South Africans | 97.7 /100 | #114 | Exceptional 11.8% |
| Brazilians | 97.7 /100 | #115 | Exceptional 11.8% |
| Immigrants | Morocco | 97.6 /100 | #116 | Exceptional 11.8% |
| Immigrants | Eastern Europe | 97.2 /100 | #117 | Exceptional 11.8% |
| Immigrants | Nigeria | 97.2 /100 | #118 | Exceptional 11.8% |
| Immigrants | Uganda | 97.2 /100 | #119 | Exceptional 11.8% |
| Immigrants | Kazakhstan | 97.0 /100 | #120 | Exceptional 11.8% |
| Immigrants | Netherlands | 96.9 /100 | #121 | Exceptional 11.8% |
| Immigrants | North Macedonia | 96.8 /100 | #122 | Exceptional 11.8% |
Demographics Similar to Yup'ik by Female Disability
In terms of female disability, the demographic groups most similar to Yup'ik are Immigrants from Denmark (11.6%, a difference of 0.0%), Palestinian (11.6%, a difference of 0.070%), Immigrants from Cameroon (11.6%, a difference of 0.070%), Immigrants from Poland (11.6%, a difference of 0.10%), and Vietnamese (11.6%, a difference of 0.10%).
| Demographics | Rating | Rank | Female Disability |
| Eastern Europeans | 99.7 /100 | #81 | Exceptional 11.5% |
| Luxembourgers | 99.6 /100 | #82 | Exceptional 11.6% |
| Immigrants | Serbia | 99.6 /100 | #83 | Exceptional 11.6% |
| Immigrants | Poland | 99.6 /100 | #84 | Exceptional 11.6% |
| Palestinians | 99.6 /100 | #85 | Exceptional 11.6% |
| Immigrants | Cameroon | 99.6 /100 | #86 | Exceptional 11.6% |
| Immigrants | Denmark | 99.5 /100 | #87 | Exceptional 11.6% |
| Yup'ik | 99.5 /100 | #88 | Exceptional 11.6% |
| Vietnamese | 99.5 /100 | #89 | Exceptional 11.6% |
| Immigrants | Romania | 99.5 /100 | #90 | Exceptional 11.6% |
| Immigrants | Zimbabwe | 99.5 /100 | #91 | Exceptional 11.6% |
| Immigrants | Czechoslovakia | 99.5 /100 | #92 | Exceptional 11.6% |
| Immigrants | Sierra Leone | 99.4 /100 | #93 | Exceptional 11.6% |
| Immigrants | Brazil | 99.4 /100 | #94 | Exceptional 11.6% |
| Immigrants | Northern Europe | 99.4 /100 | #95 | Exceptional 11.6% |