Brazilian vs Immigrants from Zaire Householder Income Over 65 years
COMPARE
Brazilian
Immigrants from Zaire
Householder Income Over 65 years
Householder Income Over 65 years Comparison
Brazilians
Immigrants from Zaire
$61,465
HOUSEHOLDER INCOME OVER 65 YEARS
62.7/ 100
METRIC RATING
159th/ 347
METRIC RANK
$54,512
HOUSEHOLDER INCOME OVER 65 YEARS
0.1/ 100
METRIC RATING
268th/ 347
METRIC RANK
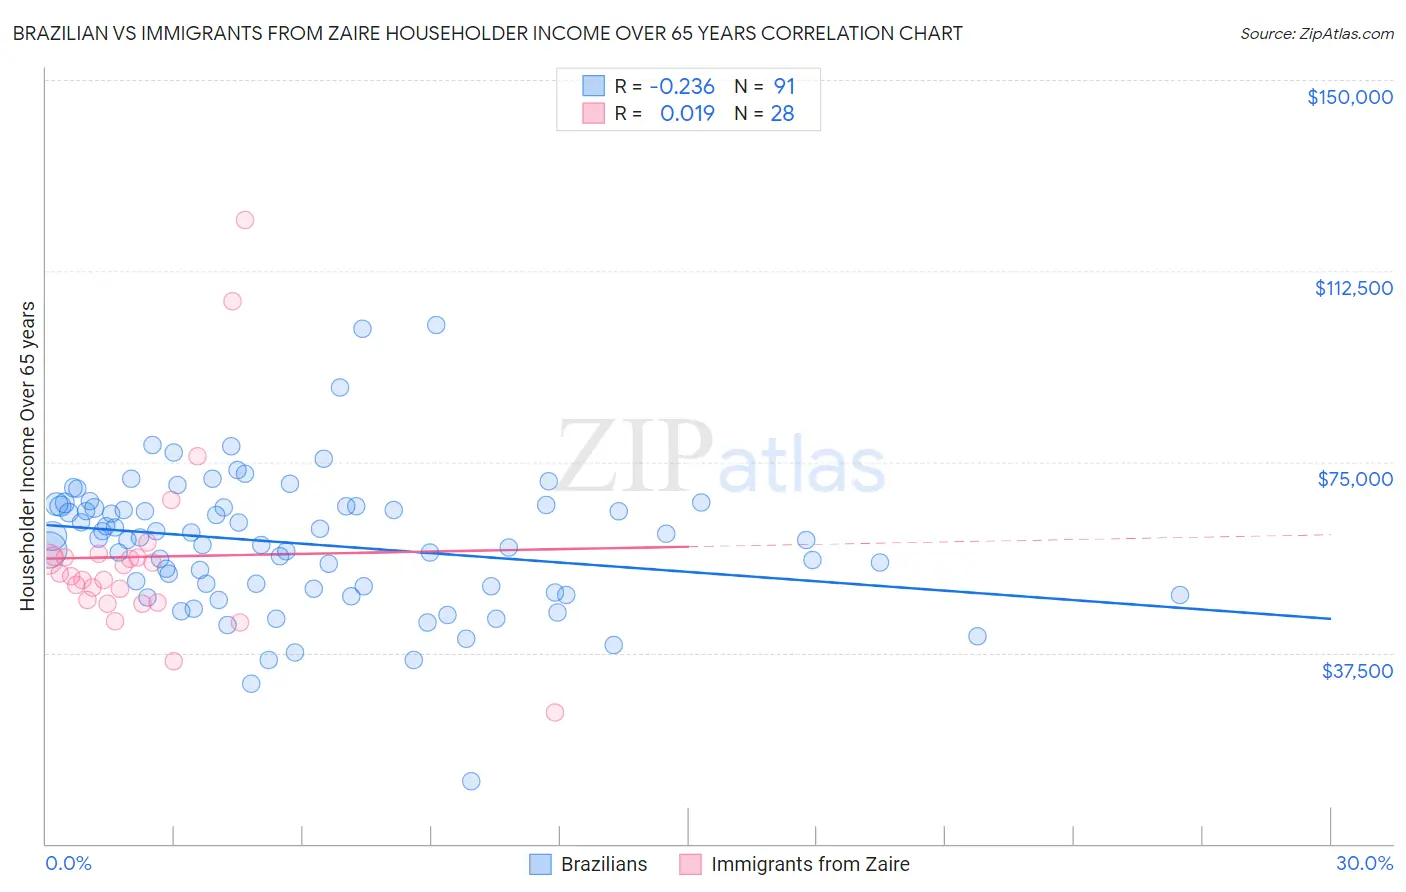
Brazilian vs Immigrants from Zaire Householder Income Over 65 years Correlation Chart
The statistical analysis conducted on geographies consisting of 322,898,345 people shows a weak negative correlation between the proportion of Brazilians and household income with householder over the age of 65 in the United States with a correlation coefficient (R) of -0.236 and weighted average of $61,465. Similarly, the statistical analysis conducted on geographies consisting of 107,158,752 people shows no correlation between the proportion of Immigrants from Zaire and household income with householder over the age of 65 in the United States with a correlation coefficient (R) of 0.019 and weighted average of $54,512, a difference of 12.8%.
Householder Income Over 65 years Correlation Summary
| Measurement | Brazilian | Immigrants from Zaire |
| Minimum | $12,293 | $25,694 |
| Maximum | $101,779 | $122,500 |
| Range | $89,486 | $96,806 |
| Mean | $58,895 | $56,341 |
| Median | $60,037 | $52,820 |
| Interquartile 25% (IQ1) | $50,127 | $47,556 |
| Interquartile 75% (IQ3) | $66,316 | $56,369 |
| Interquartile Range (IQR) | $16,189 | $8,813 |
| Standard Deviation (Sample) | $13,580 | $18,869 |
| Standard Deviation (Population) | $13,505 | $18,529 |
Similar Demographics by Householder Income Over 65 years
Demographics Similar to Brazilians by Householder Income Over 65 years
In terms of householder income over 65 years, the demographic groups most similar to Brazilians are English ($61,487, a difference of 0.040%), Portuguese ($61,440, a difference of 0.040%), Macedonian ($61,564, a difference of 0.16%), Scandinavian ($61,586, a difference of 0.20%), and Polish ($61,598, a difference of 0.22%).
| Demographics | Rating | Rank | Householder Income Over 65 years |
| Armenians | 67.3 /100 | #152 | Good $61,656 |
| Costa Ricans | 66.9 /100 | #153 | Good $61,638 |
| Swiss | 66.5 /100 | #154 | Good $61,621 |
| Poles | 65.9 /100 | #155 | Good $61,598 |
| Scandinavians | 65.6 /100 | #156 | Good $61,586 |
| Macedonians | 65.1 /100 | #157 | Good $61,564 |
| English | 63.3 /100 | #158 | Good $61,487 |
| Brazilians | 62.7 /100 | #159 | Good $61,465 |
| Portuguese | 62.1 /100 | #160 | Good $61,440 |
| Icelanders | 57.9 /100 | #161 | Average $61,270 |
| Czechs | 57.2 /100 | #162 | Average $61,244 |
| Ugandans | 55.5 /100 | #163 | Average $61,177 |
| Immigrants | North Macedonia | 55.4 /100 | #164 | Average $61,175 |
| Immigrants | Ukraine | 55.1 /100 | #165 | Average $61,163 |
| Immigrants | Eastern Africa | 55.0 /100 | #166 | Average $61,157 |
Demographics Similar to Immigrants from Zaire by Householder Income Over 65 years
In terms of householder income over 65 years, the demographic groups most similar to Immigrants from Zaire are Guatemalan ($54,526, a difference of 0.030%), Nicaraguan ($54,474, a difference of 0.070%), Jamaican ($54,560, a difference of 0.090%), Immigrants from Senegal ($54,447, a difference of 0.12%), and Belizean ($54,580, a difference of 0.13%).
| Demographics | Rating | Rank | Householder Income Over 65 years |
| Comanche | 0.2 /100 | #261 | Tragic $54,922 |
| Bangladeshis | 0.1 /100 | #262 | Tragic $54,719 |
| French American Indians | 0.1 /100 | #263 | Tragic $54,699 |
| Apache | 0.1 /100 | #264 | Tragic $54,668 |
| Belizeans | 0.1 /100 | #265 | Tragic $54,580 |
| Jamaicans | 0.1 /100 | #266 | Tragic $54,560 |
| Guatemalans | 0.1 /100 | #267 | Tragic $54,526 |
| Immigrants | Zaire | 0.1 /100 | #268 | Tragic $54,512 |
| Nicaraguans | 0.1 /100 | #269 | Tragic $54,474 |
| Immigrants | Senegal | 0.1 /100 | #270 | Tragic $54,447 |
| Liberians | 0.1 /100 | #271 | Tragic $54,356 |
| Potawatomi | 0.1 /100 | #272 | Tragic $54,212 |
| Indonesians | 0.1 /100 | #273 | Tragic $54,176 |
| Barbadians | 0.1 /100 | #274 | Tragic $54,163 |
| Cherokee | 0.1 /100 | #275 | Tragic $54,133 |