Brazilian vs Immigrants from Lebanon Married-couple Households
COMPARE
Brazilian
Immigrants from Lebanon
Married-couple Households
Married-couple Households Comparison
Brazilians
Immigrants from Lebanon
46.2%
MARRIED-COUPLE HOUSEHOLDS
35.9/ 100
METRIC RATING
185th/ 347
METRIC RANK
48.9%
MARRIED-COUPLE HOUSEHOLDS
99.6/ 100
METRIC RATING
41st/ 347
METRIC RANK
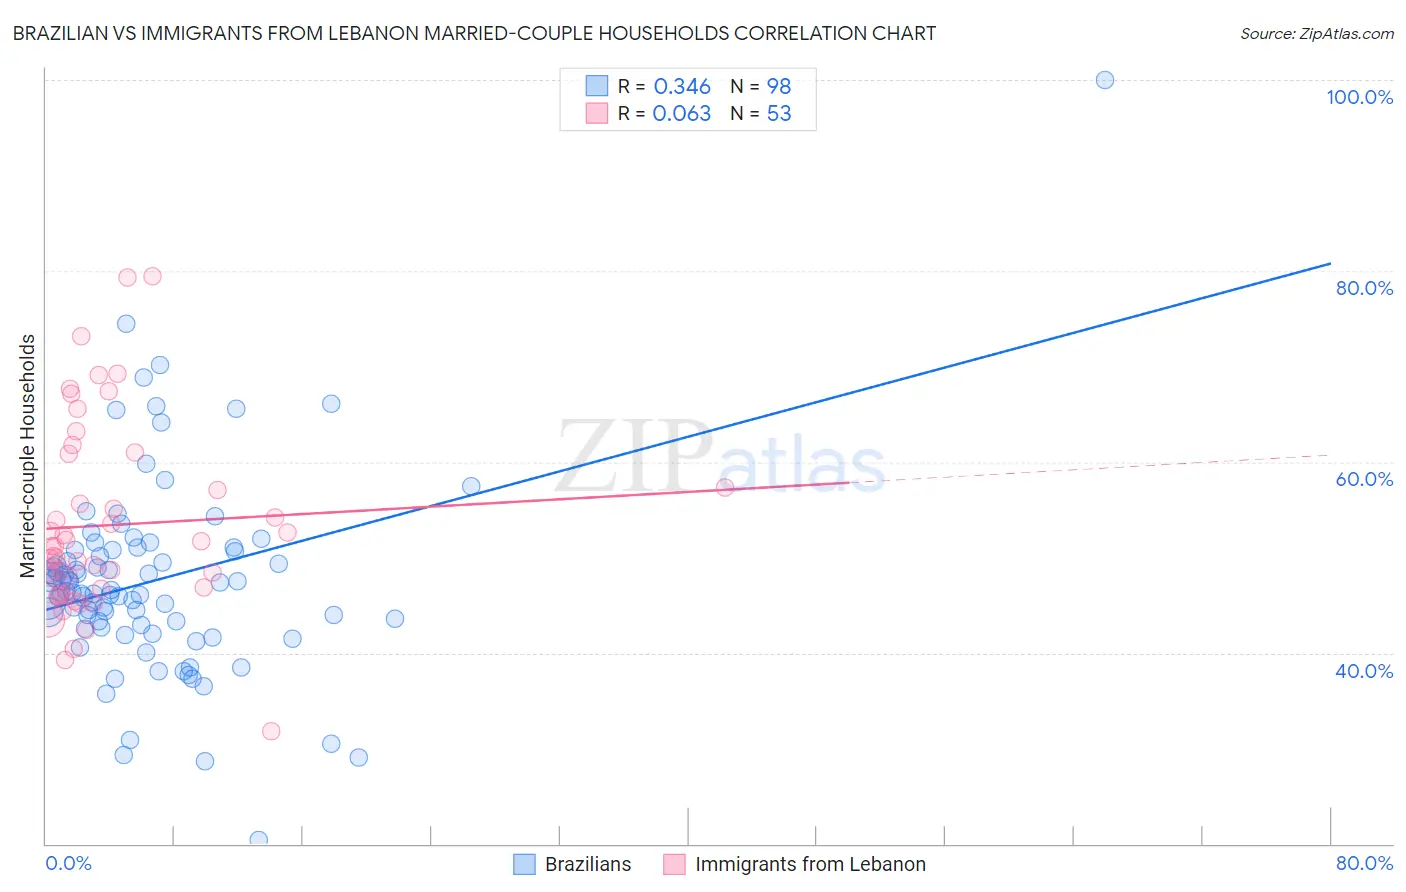
Brazilian vs Immigrants from Lebanon Married-couple Households Correlation Chart
The statistical analysis conducted on geographies consisting of 323,707,241 people shows a mild positive correlation between the proportion of Brazilians and percentage of married-couple family households in the United States with a correlation coefficient (R) of 0.346 and weighted average of 46.2%. Similarly, the statistical analysis conducted on geographies consisting of 217,124,859 people shows a slight positive correlation between the proportion of Immigrants from Lebanon and percentage of married-couple family households in the United States with a correlation coefficient (R) of 0.063 and weighted average of 48.9%, a difference of 5.8%.
Married-couple Households Correlation Summary
| Measurement | Brazilian | Immigrants from Lebanon |
| Minimum | 20.4% | 31.7% |
| Maximum | 100.0% | 79.4% |
| Range | 79.6% | 47.7% |
| Mean | 47.6% | 53.4% |
| Median | 46.4% | 51.1% |
| Interquartile 25% (IQ1) | 42.9% | 46.5% |
| Interquartile 75% (IQ3) | 50.7% | 59.0% |
| Interquartile Range (IQR) | 7.8% | 12.6% |
| Standard Deviation (Sample) | 10.4% | 10.0% |
| Standard Deviation (Population) | 10.4% | 9.9% |
Similar Demographics by Married-couple Households
Demographics Similar to Brazilians by Married-couple Households
In terms of married-couple households, the demographic groups most similar to Brazilians are Immigrants from Switzerland (46.2%, a difference of 0.040%), Immigrants from Brazil (46.2%, a difference of 0.10%), Yugoslavian (46.2%, a difference of 0.12%), Albanian (46.1%, a difference of 0.20%), and Mongolian (46.3%, a difference of 0.24%).
| Demographics | Rating | Rank | Married-couple Households |
| Immigrants | Costa Rica | 43.4 /100 | #178 | Average 46.3% |
| Immigrants | Zimbabwe | 43.0 /100 | #179 | Average 46.3% |
| Mongolians | 42.0 /100 | #180 | Average 46.3% |
| Malaysians | 41.8 /100 | #181 | Average 46.3% |
| Yugoslavians | 38.9 /100 | #182 | Fair 46.2% |
| Immigrants | Brazil | 38.3 /100 | #183 | Fair 46.2% |
| Immigrants | Switzerland | 36.9 /100 | #184 | Fair 46.2% |
| Brazilians | 35.9 /100 | #185 | Fair 46.2% |
| Albanians | 31.1 /100 | #186 | Fair 46.1% |
| Fijians | 29.2 /100 | #187 | Fair 46.1% |
| South American Indians | 28.4 /100 | #188 | Fair 46.0% |
| Immigrants | Latvia | 26.9 /100 | #189 | Fair 46.0% |
| Immigrants | Kuwait | 25.6 /100 | #190 | Fair 46.0% |
| Choctaw | 24.9 /100 | #191 | Fair 46.0% |
| Immigrants | Northern Africa | 24.6 /100 | #192 | Fair 46.0% |
Demographics Similar to Immigrants from Lebanon by Married-couple Households
In terms of married-couple households, the demographic groups most similar to Immigrants from Lebanon are Immigrants from Bolivia (48.9%, a difference of 0.030%), Lithuanian (48.9%, a difference of 0.050%), Immigrants from Vietnam (48.8%, a difference of 0.050%), Immigrants from Iran (48.8%, a difference of 0.10%), and Greek (48.9%, a difference of 0.13%).
| Demographics | Rating | Rank | Married-couple Households |
| Italians | 99.7 /100 | #34 | Exceptional 49.0% |
| Scottish | 99.7 /100 | #35 | Exceptional 49.0% |
| Iranians | 99.7 /100 | #36 | Exceptional 49.0% |
| Sri Lankans | 99.7 /100 | #37 | Exceptional 49.0% |
| Greeks | 99.7 /100 | #38 | Exceptional 48.9% |
| Lithuanians | 99.6 /100 | #39 | Exceptional 48.9% |
| Immigrants | Bolivia | 99.6 /100 | #40 | Exceptional 48.9% |
| Immigrants | Lebanon | 99.6 /100 | #41 | Exceptional 48.9% |
| Immigrants | Vietnam | 99.6 /100 | #42 | Exceptional 48.8% |
| Immigrants | Iran | 99.6 /100 | #43 | Exceptional 48.8% |
| Welsh | 99.5 /100 | #44 | Exceptional 48.8% |
| Immigrants | Eastern Asia | 99.5 /100 | #45 | Exceptional 48.8% |
| Tsimshian | 99.5 /100 | #46 | Exceptional 48.7% |
| British | 99.5 /100 | #47 | Exceptional 48.7% |
| Indians (Asian) | 99.4 /100 | #48 | Exceptional 48.7% |