Brazilian vs Immigrants from Lebanon Family Households with Children
COMPARE
Brazilian
Immigrants from Lebanon
Family Households with Children
Family Households with Children Comparison
Brazilians
Immigrants from Lebanon
27.7%
FAMILY HOUSEHOLDS WITH CHILDREN
79.6/ 100
METRIC RATING
144th/ 347
METRIC RANK
28.6%
FAMILY HOUSEHOLDS WITH CHILDREN
99.9/ 100
METRIC RATING
63rd/ 347
METRIC RANK
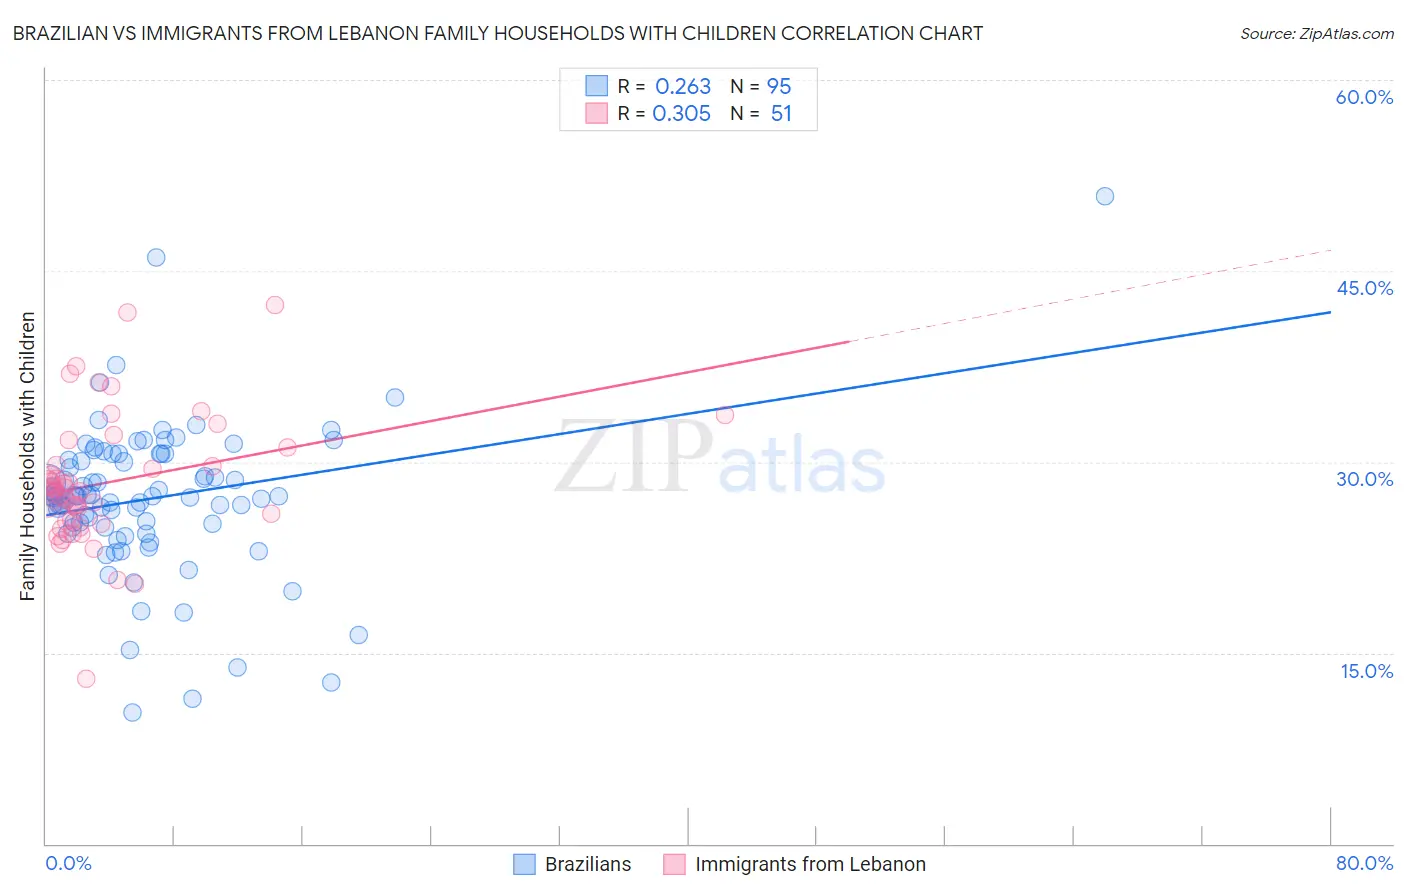
Brazilian vs Immigrants from Lebanon Family Households with Children Correlation Chart
The statistical analysis conducted on geographies consisting of 323,614,103 people shows a weak positive correlation between the proportion of Brazilians and percentage of family households with children in the United States with a correlation coefficient (R) of 0.263 and weighted average of 27.7%. Similarly, the statistical analysis conducted on geographies consisting of 217,098,842 people shows a mild positive correlation between the proportion of Immigrants from Lebanon and percentage of family households with children in the United States with a correlation coefficient (R) of 0.305 and weighted average of 28.6%, a difference of 3.3%.
Family Households with Children Correlation Summary
| Measurement | Brazilian | Immigrants from Lebanon |
| Minimum | 10.3% | 12.9% |
| Maximum | 50.9% | 42.3% |
| Range | 40.6% | 29.3% |
| Mean | 27.1% | 28.4% |
| Median | 27.3% | 27.7% |
| Interquartile 25% (IQ1) | 24.9% | 25.4% |
| Interquartile 75% (IQ3) | 30.6% | 31.2% |
| Interquartile Range (IQR) | 5.7% | 5.8% |
| Standard Deviation (Sample) | 5.9% | 5.2% |
| Standard Deviation (Population) | 5.9% | 5.2% |
Similar Demographics by Family Households with Children
Demographics Similar to Brazilians by Family Households with Children
In terms of family households with children, the demographic groups most similar to Brazilians are Immigrants from Chile (27.7%, a difference of 0.010%), Basque (27.7%, a difference of 0.010%), Immigrants from Eastern Africa (27.7%, a difference of 0.020%), Immigrants from Moldova (27.6%, a difference of 0.020%), and Osage (27.6%, a difference of 0.020%).
| Demographics | Rating | Rank | Family Households with Children |
| Immigrants | Dominican Republic | 83.9 /100 | #137 | Excellent 27.7% |
| Uruguayans | 83.2 /100 | #138 | Excellent 27.7% |
| Vietnamese | 82.6 /100 | #139 | Excellent 27.7% |
| Spanish | 81.8 /100 | #140 | Excellent 27.7% |
| Immigrants | Eastern Asia | 81.7 /100 | #141 | Excellent 27.7% |
| Swiss | 81.4 /100 | #142 | Excellent 27.7% |
| Immigrants | Eastern Africa | 80.2 /100 | #143 | Excellent 27.7% |
| Brazilians | 79.6 /100 | #144 | Good 27.7% |
| Immigrants | Chile | 79.5 /100 | #145 | Good 27.7% |
| Basques | 79.5 /100 | #146 | Good 27.7% |
| Immigrants | Moldova | 79.1 /100 | #147 | Good 27.6% |
| Osage | 79.0 /100 | #148 | Good 27.6% |
| Menominee | 78.9 /100 | #149 | Good 27.6% |
| Argentineans | 78.5 /100 | #150 | Good 27.6% |
| Portuguese | 77.8 /100 | #151 | Good 27.6% |
Demographics Similar to Immigrants from Lebanon by Family Households with Children
In terms of family households with children, the demographic groups most similar to Immigrants from Lebanon are Immigrants from Ghana (28.6%, a difference of 0.010%), Egyptian (28.6%, a difference of 0.010%), Filipino (28.6%, a difference of 0.070%), Hmong (28.6%, a difference of 0.090%), and Immigrants from Nigeria (28.6%, a difference of 0.14%).
| Demographics | Rating | Rank | Family Households with Children |
| Immigrants | Guatemala | 100.0 /100 | #56 | Exceptional 28.8% |
| Danes | 100.0 /100 | #57 | Exceptional 28.7% |
| Hawaiians | 100.0 /100 | #58 | Exceptional 28.7% |
| Immigrants | Nigeria | 100.0 /100 | #59 | Exceptional 28.6% |
| Hmong | 99.9 /100 | #60 | Exceptional 28.6% |
| Immigrants | Ghana | 99.9 /100 | #61 | Exceptional 28.6% |
| Egyptians | 99.9 /100 | #62 | Exceptional 28.6% |
| Immigrants | Lebanon | 99.9 /100 | #63 | Exceptional 28.6% |
| Filipinos | 99.9 /100 | #64 | Exceptional 28.6% |
| Hondurans | 99.9 /100 | #65 | Exceptional 28.5% |
| Immigrants | Egypt | 99.9 /100 | #66 | Exceptional 28.5% |
| Ghanaians | 99.9 /100 | #67 | Exceptional 28.5% |
| Houma | 99.9 /100 | #68 | Exceptional 28.5% |
| Immigrants | Korea | 99.9 /100 | #69 | Exceptional 28.5% |
| Immigrants | Honduras | 99.9 /100 | #70 | Exceptional 28.5% |