Maltese vs West Indian Householder Income Ages 25 - 44 years
COMPARE
Maltese
West Indian
Householder Income Ages 25 - 44 years
Householder Income Ages 25 - 44 years Comparison
Maltese
West Indians
$110,064
HOUSEHOLDER INCOME AGES 25 - 44 YEARS
100.0/ 100
METRIC RATING
31st/ 347
METRIC RANK
$87,205
HOUSEHOLDER INCOME AGES 25 - 44 YEARS
1.7/ 100
METRIC RATING
242nd/ 347
METRIC RANK
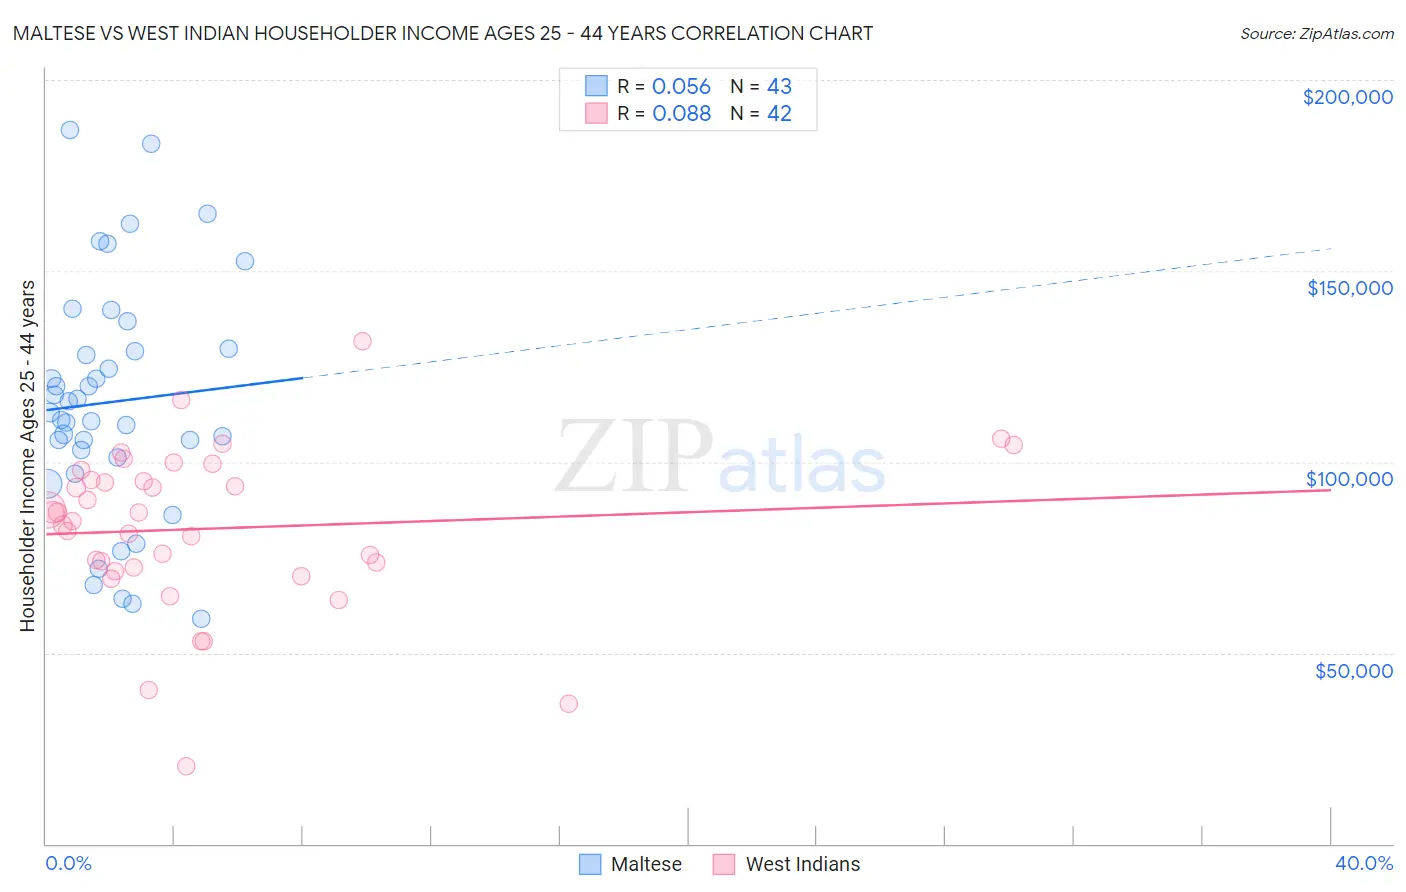
Maltese vs West Indian Householder Income Ages 25 - 44 years Correlation Chart
The statistical analysis conducted on geographies consisting of 126,133,875 people shows a slight positive correlation between the proportion of Maltese and household income with householder between the ages 25 and 44 in the United States with a correlation coefficient (R) of 0.056 and weighted average of $110,064. Similarly, the statistical analysis conducted on geographies consisting of 253,630,243 people shows a slight positive correlation between the proportion of West Indians and household income with householder between the ages 25 and 44 in the United States with a correlation coefficient (R) of 0.088 and weighted average of $87,205, a difference of 26.2%.
Householder Income Ages 25 - 44 years Correlation Summary
| Measurement | Maltese | West Indian |
| Minimum | $58,867 | $20,234 |
| Maximum | $186,969 | $131,705 |
| Range | $128,102 | $111,471 |
| Mean | $115,666 | $82,528 |
| Median | $112,847 | $85,571 |
| Interquartile 25% (IQ1) | $101,168 | $72,417 |
| Interquartile 75% (IQ3) | $129,763 | $95,404 |
| Interquartile Range (IQR) | $28,595 | $22,987 |
| Standard Deviation (Sample) | $30,812 | $21,318 |
| Standard Deviation (Population) | $30,451 | $21,063 |
Similar Demographics by Householder Income Ages 25 - 44 years
Demographics Similar to Maltese by Householder Income Ages 25 - 44 years
In terms of householder income ages 25 - 44 years, the demographic groups most similar to Maltese are Immigrants from Greece ($110,103, a difference of 0.040%), Turkish ($110,318, a difference of 0.23%), Immigrants from Denmark ($110,363, a difference of 0.27%), Immigrants from Sri Lanka ($109,741, a difference of 0.29%), and Russian ($110,398, a difference of 0.30%).
| Demographics | Rating | Rank | Householder Income Ages 25 - 44 years |
| Immigrants | Sweden | 100.0 /100 | #24 | Exceptional $112,010 |
| Immigrants | Northern Europe | 100.0 /100 | #25 | Exceptional $111,676 |
| Immigrants | Asia | 100.0 /100 | #26 | Exceptional $110,787 |
| Russians | 100.0 /100 | #27 | Exceptional $110,398 |
| Immigrants | Denmark | 100.0 /100 | #28 | Exceptional $110,363 |
| Turks | 100.0 /100 | #29 | Exceptional $110,318 |
| Immigrants | Greece | 100.0 /100 | #30 | Exceptional $110,103 |
| Maltese | 100.0 /100 | #31 | Exceptional $110,064 |
| Immigrants | Sri Lanka | 100.0 /100 | #32 | Exceptional $109,741 |
| Bhutanese | 100.0 /100 | #33 | Exceptional $109,520 |
| Bolivians | 100.0 /100 | #34 | Exceptional $109,372 |
| Immigrants | Switzerland | 100.0 /100 | #35 | Exceptional $109,185 |
| Latvians | 100.0 /100 | #36 | Exceptional $108,926 |
| Immigrants | Russia | 100.0 /100 | #37 | Exceptional $108,751 |
| Soviet Union | 100.0 /100 | #38 | Exceptional $108,457 |
Demographics Similar to West Indians by Householder Income Ages 25 - 44 years
In terms of householder income ages 25 - 44 years, the demographic groups most similar to West Indians are Immigrants from West Indies ($87,063, a difference of 0.16%), Immigrants from Venezuela ($87,038, a difference of 0.19%), Immigrants from El Salvador ($86,913, a difference of 0.34%), Immigrants from Burma/Myanmar ($86,736, a difference of 0.54%), and Nigerian ($87,730, a difference of 0.60%).
| Demographics | Rating | Rank | Householder Income Ages 25 - 44 years |
| Bermudans | 2.9 /100 | #235 | Tragic $88,231 |
| Immigrants | Cameroon | 2.9 /100 | #236 | Tragic $88,214 |
| Salvadorans | 2.8 /100 | #237 | Tragic $88,198 |
| Alaska Natives | 2.6 /100 | #238 | Tragic $88,018 |
| Immigrants | Ghana | 2.2 /100 | #239 | Tragic $87,760 |
| Nicaraguans | 2.2 /100 | #240 | Tragic $87,751 |
| Nigerians | 2.2 /100 | #241 | Tragic $87,730 |
| West Indians | 1.7 /100 | #242 | Tragic $87,205 |
| Immigrants | West Indies | 1.5 /100 | #243 | Tragic $87,063 |
| Immigrants | Venezuela | 1.5 /100 | #244 | Tragic $87,038 |
| Immigrants | El Salvador | 1.4 /100 | #245 | Tragic $86,913 |
| Immigrants | Burma/Myanmar | 1.3 /100 | #246 | Tragic $86,736 |
| Immigrants | Nigeria | 1.2 /100 | #247 | Tragic $86,589 |
| Immigrants | Sudan | 0.9 /100 | #248 | Tragic $86,109 |
| French American Indians | 0.8 /100 | #249 | Tragic $85,899 |