Barbadian vs West Indian Householder Income Ages 25 - 44 years
COMPARE
Barbadian
West Indian
Householder Income Ages 25 - 44 years
Householder Income Ages 25 - 44 years Comparison
Barbadians
West Indians
$89,565
HOUSEHOLDER INCOME AGES 25 - 44 YEARS
5.9/ 100
METRIC RATING
224th/ 347
METRIC RANK
$87,205
HOUSEHOLDER INCOME AGES 25 - 44 YEARS
1.7/ 100
METRIC RATING
242nd/ 347
METRIC RANK
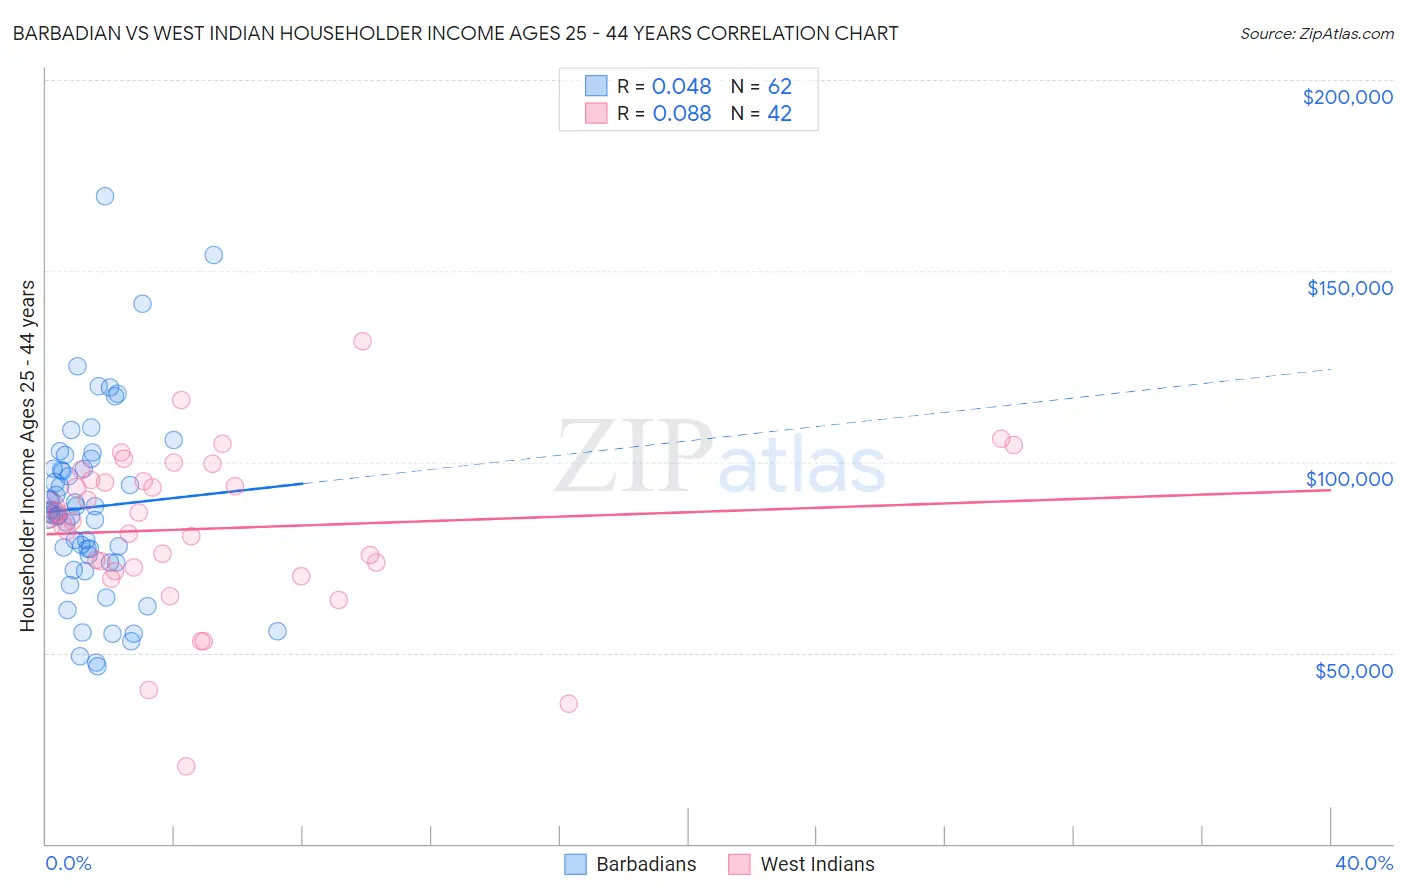
Barbadian vs West Indian Householder Income Ages 25 - 44 years Correlation Chart
The statistical analysis conducted on geographies consisting of 141,212,757 people shows no correlation between the proportion of Barbadians and household income with householder between the ages 25 and 44 in the United States with a correlation coefficient (R) of 0.048 and weighted average of $89,565. Similarly, the statistical analysis conducted on geographies consisting of 253,630,243 people shows a slight positive correlation between the proportion of West Indians and household income with householder between the ages 25 and 44 in the United States with a correlation coefficient (R) of 0.088 and weighted average of $87,205, a difference of 2.7%.
Householder Income Ages 25 - 44 years Correlation Summary
| Measurement | Barbadian | West Indian |
| Minimum | $46,484 | $20,234 |
| Maximum | $169,656 | $131,705 |
| Range | $123,172 | $111,471 |
| Mean | $88,113 | $82,528 |
| Median | $86,577 | $85,571 |
| Interquartile 25% (IQ1) | $73,781 | $72,417 |
| Interquartile 75% (IQ3) | $98,316 | $95,404 |
| Interquartile Range (IQR) | $24,535 | $22,987 |
| Standard Deviation (Sample) | $24,335 | $21,318 |
| Standard Deviation (Population) | $24,138 | $21,063 |
Demographics Similar to Barbadians and West Indians by Householder Income Ages 25 - 44 years
In terms of householder income ages 25 - 44 years, the demographic groups most similar to Barbadians are Immigrants from Guyana ($89,586, a difference of 0.020%), Immigrants from Panama ($89,451, a difference of 0.13%), Immigrants from Iraq ($89,444, a difference of 0.14%), Immigrants from St. Vincent and the Grenadines ($88,888, a difference of 0.76%), and Immigrants from Bosnia and Herzegovina ($88,819, a difference of 0.84%). Similarly, the demographic groups most similar to West Indians are Immigrants from West Indies ($87,063, a difference of 0.16%), Nigerian ($87,730, a difference of 0.60%), Nicaraguan ($87,751, a difference of 0.63%), Immigrants from Ghana ($87,760, a difference of 0.64%), and Alaska Native ($88,018, a difference of 0.93%).
| Demographics | Rating | Rank | Householder Income Ages 25 - 44 years |
| Immigrants | Guyana | 5.9 /100 | #223 | Tragic $89,586 |
| Barbadians | 5.9 /100 | #224 | Tragic $89,565 |
| Immigrants | Panama | 5.5 /100 | #225 | Tragic $89,451 |
| Immigrants | Iraq | 5.5 /100 | #226 | Tragic $89,444 |
| Immigrants | St. Vincent and the Grenadines | 4.1 /100 | #227 | Tragic $88,888 |
| Immigrants | Bosnia and Herzegovina | 4.0 /100 | #228 | Tragic $88,819 |
| Immigrants | Barbados | 3.7 /100 | #229 | Tragic $88,687 |
| Alaskan Athabascans | 3.3 /100 | #230 | Tragic $88,446 |
| Immigrants | Grenada | 3.0 /100 | #231 | Tragic $88,311 |
| Immigrants | Nonimmigrants | 3.0 /100 | #232 | Tragic $88,301 |
| Malaysians | 3.0 /100 | #233 | Tragic $88,291 |
| Venezuelans | 2.9 /100 | #234 | Tragic $88,232 |
| Bermudans | 2.9 /100 | #235 | Tragic $88,231 |
| Immigrants | Cameroon | 2.9 /100 | #236 | Tragic $88,214 |
| Salvadorans | 2.8 /100 | #237 | Tragic $88,198 |
| Alaska Natives | 2.6 /100 | #238 | Tragic $88,018 |
| Immigrants | Ghana | 2.2 /100 | #239 | Tragic $87,760 |
| Nicaraguans | 2.2 /100 | #240 | Tragic $87,751 |
| Nigerians | 2.2 /100 | #241 | Tragic $87,730 |
| West Indians | 1.7 /100 | #242 | Tragic $87,205 |
| Immigrants | West Indies | 1.5 /100 | #243 | Tragic $87,063 |