Immigrants from Latin America vs Jamaican Householder Income Ages 25 - 44 years
COMPARE
Immigrants from Latin America
Jamaican
Householder Income Ages 25 - 44 years
Householder Income Ages 25 - 44 years Comparison
Immigrants from Latin America
Jamaicans
$82,166
HOUSEHOLDER INCOME AGES 25 - 44 YEARS
0.1/ 100
METRIC RATING
287th/ 347
METRIC RANK
$83,933
HOUSEHOLDER INCOME AGES 25 - 44 YEARS
0.3/ 100
METRIC RATING
270th/ 347
METRIC RANK
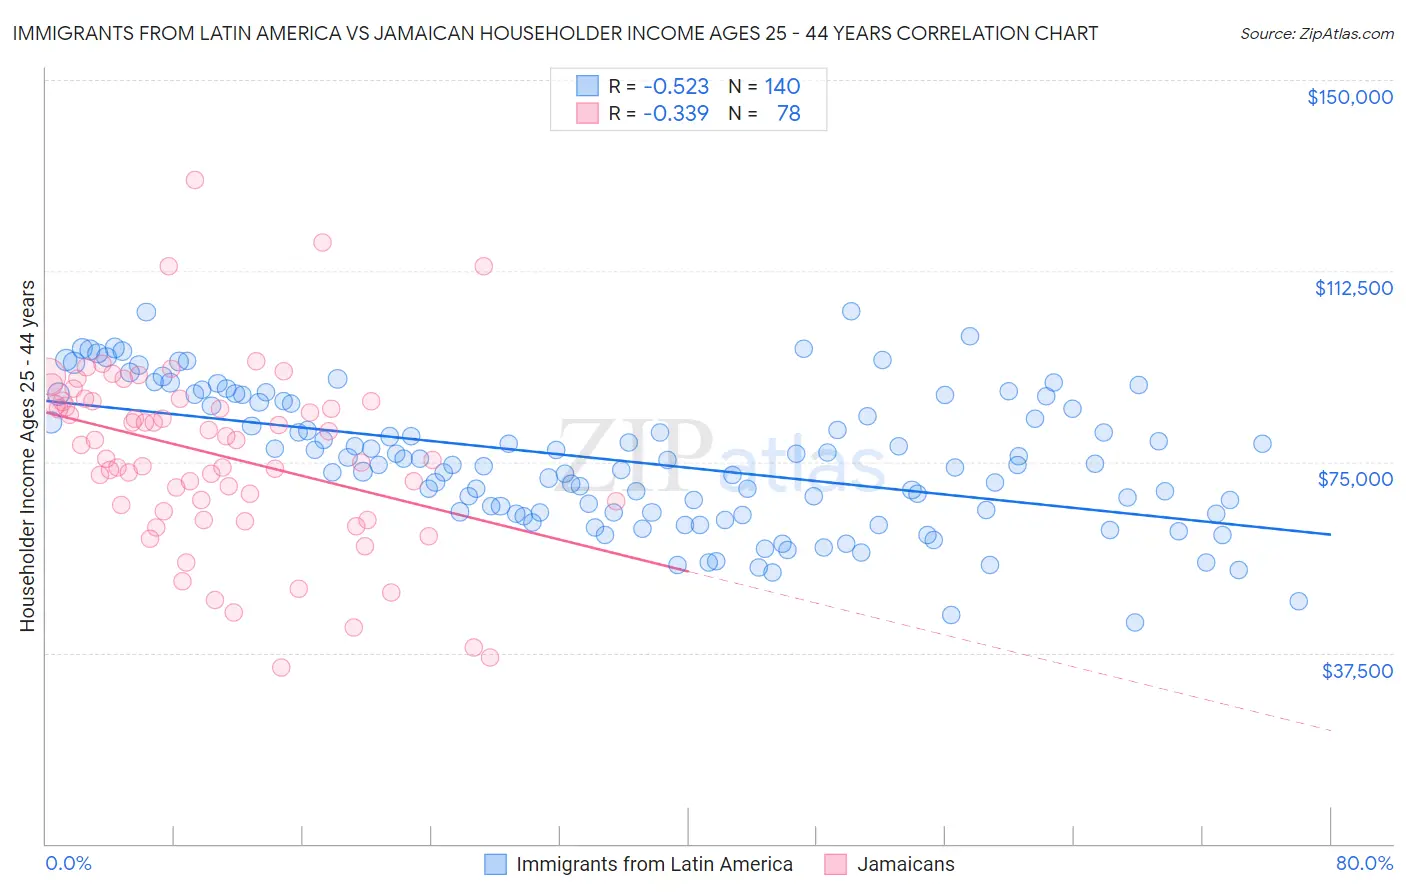
Immigrants from Latin America vs Jamaican Householder Income Ages 25 - 44 years Correlation Chart
The statistical analysis conducted on geographies consisting of 553,849,176 people shows a substantial negative correlation between the proportion of Immigrants from Latin America and household income with householder between the ages 25 and 44 in the United States with a correlation coefficient (R) of -0.523 and weighted average of $82,166. Similarly, the statistical analysis conducted on geographies consisting of 367,030,612 people shows a mild negative correlation between the proportion of Jamaicans and household income with householder between the ages 25 and 44 in the United States with a correlation coefficient (R) of -0.339 and weighted average of $83,933, a difference of 2.1%.
Householder Income Ages 25 - 44 years Correlation Summary
| Measurement | Immigrants from Latin America | Jamaican |
| Minimum | $43,333 | $34,529 |
| Maximum | $104,675 | $130,290 |
| Range | $61,342 | $95,761 |
| Mean | $75,262 | $76,521 |
| Median | $74,553 | $78,807 |
| Interquartile 25% (IQ1) | $65,072 | $66,599 |
| Interquartile 75% (IQ3) | $86,812 | $86,908 |
| Interquartile Range (IQR) | $21,740 | $20,309 |
| Standard Deviation (Sample) | $13,368 | $17,827 |
| Standard Deviation (Population) | $13,320 | $17,712 |
Demographics Similar to Immigrants from Latin America and Jamaicans by Householder Income Ages 25 - 44 years
In terms of householder income ages 25 - 44 years, the demographic groups most similar to Immigrants from Latin America are Ute ($82,166, a difference of 0.0%), Comanche ($82,152, a difference of 0.020%), Immigrants from Somalia ($82,188, a difference of 0.030%), Immigrants from Middle Africa ($82,254, a difference of 0.11%), and Guatemalan ($82,331, a difference of 0.20%). Similarly, the demographic groups most similar to Jamaicans are Spanish American Indian ($84,085, a difference of 0.18%), Somali ($83,752, a difference of 0.22%), Spanish American ($83,722, a difference of 0.25%), Iroquois ($83,682, a difference of 0.30%), and Subsaharan African ($84,235, a difference of 0.36%).
| Demographics | Rating | Rank | Householder Income Ages 25 - 44 years |
| Sub-Saharan Africans | 0.3 /100 | #268 | Tragic $84,235 |
| Spanish American Indians | 0.3 /100 | #269 | Tragic $84,085 |
| Jamaicans | 0.3 /100 | #270 | Tragic $83,933 |
| Somalis | 0.2 /100 | #271 | Tragic $83,752 |
| Spanish Americans | 0.2 /100 | #272 | Tragic $83,722 |
| Iroquois | 0.2 /100 | #273 | Tragic $83,682 |
| Marshallese | 0.2 /100 | #274 | Tragic $83,575 |
| Immigrants | Jamaica | 0.2 /100 | #275 | Tragic $83,298 |
| Immigrants | Belize | 0.2 /100 | #276 | Tragic $83,141 |
| Paiute | 0.2 /100 | #277 | Tragic $82,984 |
| Senegalese | 0.2 /100 | #278 | Tragic $82,852 |
| Pima | 0.1 /100 | #279 | Tragic $82,821 |
| Colville | 0.1 /100 | #280 | Tragic $82,604 |
| Cajuns | 0.1 /100 | #281 | Tragic $82,393 |
| Central American Indians | 0.1 /100 | #282 | Tragic $82,355 |
| Guatemalans | 0.1 /100 | #283 | Tragic $82,331 |
| Immigrants | Middle Africa | 0.1 /100 | #284 | Tragic $82,254 |
| Immigrants | Somalia | 0.1 /100 | #285 | Tragic $82,188 |
| Ute | 0.1 /100 | #286 | Tragic $82,166 |
| Immigrants | Latin America | 0.1 /100 | #287 | Tragic $82,166 |
| Comanche | 0.1 /100 | #288 | Tragic $82,152 |