Delaware vs Jamaican Householder Income Ages 25 - 44 years
COMPARE
Delaware
Jamaican
Householder Income Ages 25 - 44 years
Householder Income Ages 25 - 44 years Comparison
Delaware
Jamaicans
$89,876
HOUSEHOLDER INCOME AGES 25 - 44 YEARS
6.9/ 100
METRIC RATING
219th/ 347
METRIC RANK
$83,933
HOUSEHOLDER INCOME AGES 25 - 44 YEARS
0.3/ 100
METRIC RATING
270th/ 347
METRIC RANK
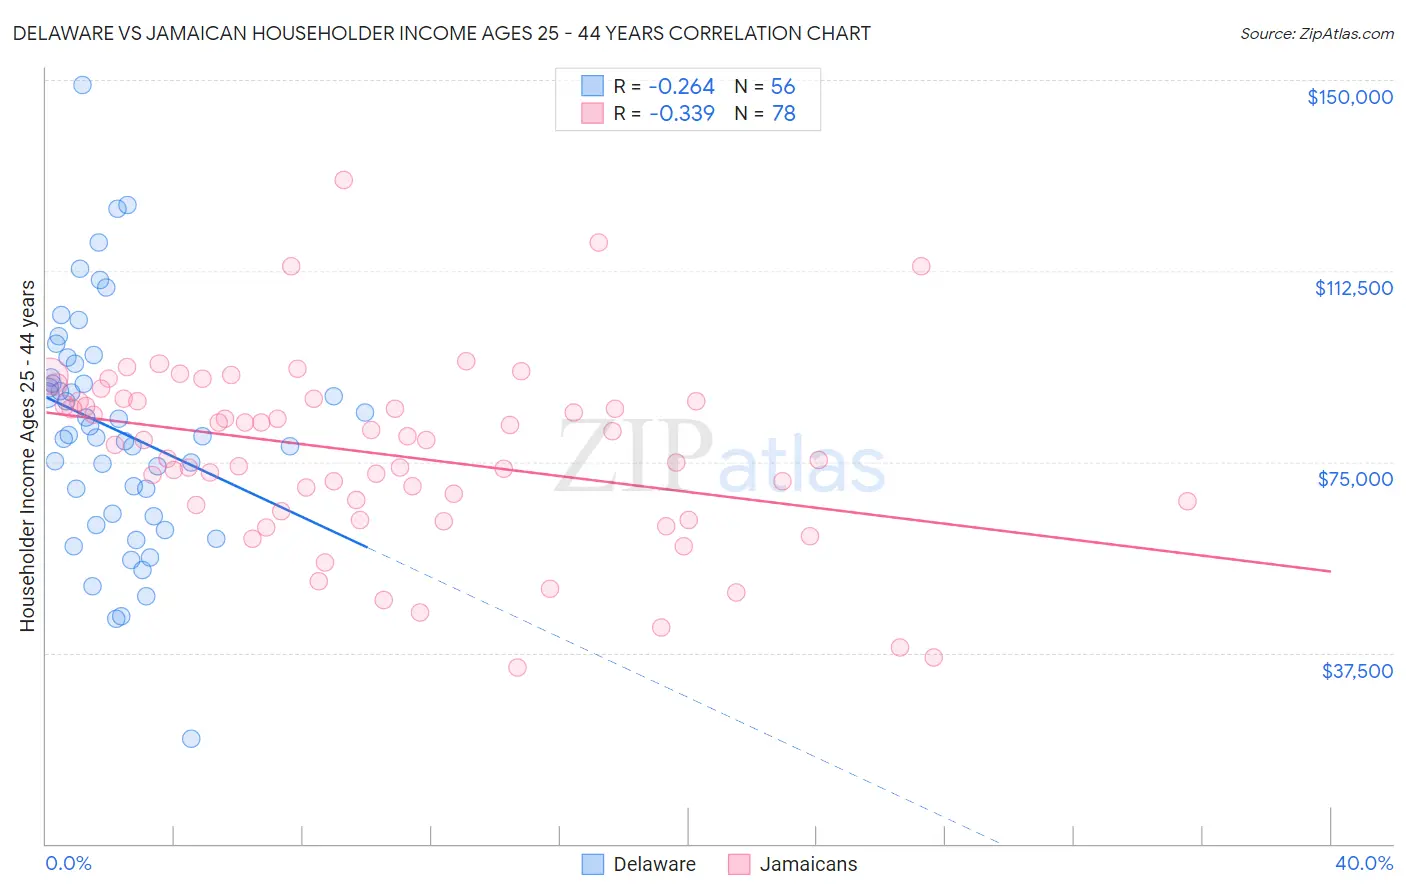
Delaware vs Jamaican Householder Income Ages 25 - 44 years Correlation Chart
The statistical analysis conducted on geographies consisting of 96,132,601 people shows a weak negative correlation between the proportion of Delaware and household income with householder between the ages 25 and 44 in the United States with a correlation coefficient (R) of -0.264 and weighted average of $89,876. Similarly, the statistical analysis conducted on geographies consisting of 367,030,612 people shows a mild negative correlation between the proportion of Jamaicans and household income with householder between the ages 25 and 44 in the United States with a correlation coefficient (R) of -0.339 and weighted average of $83,933, a difference of 7.1%.
Householder Income Ages 25 - 44 years Correlation Summary
| Measurement | Delaware | Jamaican |
| Minimum | $20,625 | $34,529 |
| Maximum | $148,987 | $130,290 |
| Range | $128,362 | $95,761 |
| Mean | $81,167 | $76,521 |
| Median | $80,133 | $78,807 |
| Interquartile 25% (IQ1) | $64,556 | $66,599 |
| Interquartile 75% (IQ3) | $92,864 | $86,908 |
| Interquartile Range (IQR) | $28,308 | $20,309 |
| Standard Deviation (Sample) | $22,962 | $17,827 |
| Standard Deviation (Population) | $22,756 | $17,712 |
Similar Demographics by Householder Income Ages 25 - 44 years
Demographics Similar to Delaware by Householder Income Ages 25 - 44 years
In terms of householder income ages 25 - 44 years, the demographic groups most similar to Delaware are Trinidadian and Tobagonian ($89,856, a difference of 0.020%), Guyanese ($89,940, a difference of 0.070%), Scotch-Irish ($89,969, a difference of 0.10%), Immigrants from Trinidad and Tobago ($89,748, a difference of 0.14%), and Immigrants from Ecuador ($89,673, a difference of 0.23%).
| Demographics | Rating | Rank | Householder Income Ages 25 - 44 years |
| Hawaiians | 10.6 /100 | #212 | Poor $90,722 |
| Immigrants | Bangladesh | 9.3 /100 | #213 | Tragic $90,448 |
| Immigrants | Africa | 8.9 /100 | #214 | Tragic $90,372 |
| Panamanians | 8.1 /100 | #215 | Tragic $90,193 |
| Ghanaians | 7.9 /100 | #216 | Tragic $90,137 |
| Scotch-Irish | 7.3 /100 | #217 | Tragic $89,969 |
| Guyanese | 7.1 /100 | #218 | Tragic $89,940 |
| Delaware | 6.9 /100 | #219 | Tragic $89,876 |
| Trinidadians and Tobagonians | 6.8 /100 | #220 | Tragic $89,856 |
| Immigrants | Trinidad and Tobago | 6.5 /100 | #221 | Tragic $89,748 |
| Immigrants | Ecuador | 6.2 /100 | #222 | Tragic $89,673 |
| Immigrants | Guyana | 5.9 /100 | #223 | Tragic $89,586 |
| Barbadians | 5.9 /100 | #224 | Tragic $89,565 |
| Immigrants | Panama | 5.5 /100 | #225 | Tragic $89,451 |
| Immigrants | Iraq | 5.5 /100 | #226 | Tragic $89,444 |
Demographics Similar to Jamaicans by Householder Income Ages 25 - 44 years
In terms of householder income ages 25 - 44 years, the demographic groups most similar to Jamaicans are Spanish American Indian ($84,085, a difference of 0.18%), Somali ($83,752, a difference of 0.22%), Spanish American ($83,722, a difference of 0.25%), Iroquois ($83,682, a difference of 0.30%), and Subsaharan African ($84,235, a difference of 0.36%).
| Demographics | Rating | Rank | Householder Income Ages 25 - 44 years |
| Belizeans | 0.4 /100 | #263 | Tragic $84,534 |
| Osage | 0.4 /100 | #264 | Tragic $84,461 |
| Sudanese | 0.4 /100 | #265 | Tragic $84,401 |
| Immigrants | Cabo Verde | 0.3 /100 | #266 | Tragic $84,304 |
| Hmong | 0.3 /100 | #267 | Tragic $84,258 |
| Sub-Saharan Africans | 0.3 /100 | #268 | Tragic $84,235 |
| Spanish American Indians | 0.3 /100 | #269 | Tragic $84,085 |
| Jamaicans | 0.3 /100 | #270 | Tragic $83,933 |
| Somalis | 0.2 /100 | #271 | Tragic $83,752 |
| Spanish Americans | 0.2 /100 | #272 | Tragic $83,722 |
| Iroquois | 0.2 /100 | #273 | Tragic $83,682 |
| Marshallese | 0.2 /100 | #274 | Tragic $83,575 |
| Immigrants | Jamaica | 0.2 /100 | #275 | Tragic $83,298 |
| Immigrants | Belize | 0.2 /100 | #276 | Tragic $83,141 |
| Paiute | 0.2 /100 | #277 | Tragic $82,984 |