Bermudan vs Australian Family Households with Children

COMPARE

Bermudan
Race
Ancestry
AfghanAfricanAlaska NativeAlaskan AthabascanAlbanianAleutAlsatianAmericanApacheArabArapahoArgentineanArmenianAssyrian/Chaldean/SyriacAustrianBahamianBangladeshiBarbadianBasqueBelgianBelizeanBermudanBhutaneseBlackfeetBolivianBrazilianBritishBritish West IndianBulgarianBurmeseCajunCambodianCanadianCape VerdeanCarpatho RusynCelticCentral AmericanCentral American IndianCherokeeCheyenneChickasawChileanChineseChippewaChoctawColombianColvilleComancheCosta RicanCreeCreekCroatianCrowCubanCypriotCzechCzechoslovakianDanishDelawareDominicanDutchDutch West IndianEastern EuropeanEcuadorianEgyptianEnglishEstonianEthiopianEuropeanFijianFilipinoFinnishFrenchFrench American IndianFrench CanadianGermanGerman RussianGhanaianGreekGuamanian/ChamorroGuatemalanGuyaneseHaitianHmongHonduranHopiHoumaHungarianIcelanderIndian (Asian)IndonesianInupiatIranianIraqiIrishIroquoisIsraeliItalianJamaicanJapaneseJordanianKenyanKiowaKoreanLaotianLatvianLebaneseLiberianLithuanianLumbeeLuxembourgerMacedonianMalaysianMalteseMarshalleseMenomineeMexicanMexican American IndianMongolianMoroccanNative HawaiianNavajoNepaleseNew ZealanderNicaraguanNigerianNorthern EuropeanNorwegianOkinawanOsageOttawaPaiutePakistaniPalestinianPanamanianParaguayanPennsylvania GermanPeruvianPimaPolishPortuguesePotawatomiPuebloPuerto RicanPuget Sound SalishRomanianRussianSalvadoranSamoanScandinavianScotch-IrishScottishSeminoleSenegaleseSerbianShoshoneSierra LeoneanSiouxSlavicSlovakSloveneSomaliSouth AfricanSouth AmericanSouth American IndianSoviet UnionSpaniardSpanishSpanish AmericanSpanish American IndianSri LankanSubsaharan AfricanSudaneseSwedishSwissSyrianTaiwaneseThaiTlingit-HaidaTohono O'OdhamTonganTrinidadian and TobagonianTsimshianTurkishU.S. Virgin IslanderUgandanUkrainianUruguayanUteVenezuelanVietnameseWelshWest IndianYakamaYaquiYugoslavianYumanYup'ikZimbabwean
Immigration
NonimmigrantsImmigrantsAfghanistanAfricaAlbaniaArgentinaArmeniaAsiaAustraliaAustriaBahamasBangladeshBarbadosBelarusBelgiumBelizeBoliviaBosnia and HerzegovinaBrazilBulgariaBurma/MyanmarCabo VerdeCambodiaCameroonCanadaCaribbeanCentral AmericaChileChinaColombiaCongoCosta RicaCroatiaCubaCzechoslovakiaDenmarkDominicaDominican RepublicEastern AfricaEastern AsiaEastern EuropeEcuadorEgyptEl SalvadorEnglandEritreaEthiopiaEuropeFijiFranceGermanyGhanaGreeceGrenadaGuatemalaGuyanaHaitiHondurasHong KongHungaryIndiaIndonesiaIranIraqIrelandIsraelItalyJamaicaJapanJordanKazakhstanKenyaKoreaKuwaitLaosLatin AmericaLatviaLebanonLiberiaLithuaniaMalaysiaMexicoMicronesiaMiddle AfricaMoldovaMoroccoNepalNetherlandsNicaraguaNigeriaNorth AmericaNorth MacedoniaNorthern AfricaNorthern EuropeNorwayOceaniaPakistanPanamaPeruPhilippinesPolandPortugalRomaniaRussiaSaudi ArabiaScotlandSenegalSerbiaSierra LeoneSingaporeSomaliaSouth AfricaSouth AmericaSouth Central AsiaSouth Eastern AsiaSouthern EuropeSpainSri LankaSt. Vincent and the GrenadinesSudanSwedenSwitzerlandSyriaTaiwanThailandTrinidad and TobagoTurkeyUgandaUkraineUruguayUzbekistanVenezuelaVietnamWest IndiesWestern AfricaWestern AsiaWestern EuropeYemenZaireZimbabweAzores
Australian
Race
Ancestry
AfghanAfricanAlaska NativeAlaskan AthabascanAlbanianAleutAlsatianAmericanApacheArabArapahoArgentineanArmenianAssyrian/Chaldean/SyriacAustralianAustrianBahamianBangladeshiBarbadianBasqueBelgianBelizeanBhutaneseBlackfeetBolivianBrazilianBritishBritish West IndianBulgarianBurmeseCajunCambodianCanadianCape VerdeanCarpatho RusynCelticCentral AmericanCentral American IndianCherokeeCheyenneChickasawChileanChineseChippewaChoctawColombianColvilleComancheCosta RicanCreeCreekCroatianCrowCubanCypriotCzechCzechoslovakianDanishDelawareDominicanDutchDutch West IndianEastern EuropeanEcuadorianEgyptianEnglishEstonianEthiopianEuropeanFijianFilipinoFinnishFrenchFrench American IndianFrench CanadianGermanGerman RussianGhanaianGreekGuamanian/ChamorroGuatemalanGuyaneseHaitianHmongHonduranHopiHoumaHungarianIcelanderIndian (Asian)IndonesianInupiatIranianIraqiIrishIroquoisIsraeliItalianJamaicanJapaneseJordanianKenyanKiowaKoreanLaotianLatvianLebaneseLiberianLithuanianLumbeeLuxembourgerMacedonianMalaysianMalteseMarshalleseMenomineeMexicanMexican American IndianMongolianMoroccanNative HawaiianNavajoNepaleseNew ZealanderNicaraguanNigerianNorthern EuropeanNorwegianOkinawanOsageOttawaPaiutePakistaniPalestinianPanamanianParaguayanPennsylvania GermanPeruvianPimaPolishPortuguesePotawatomiPuebloPuerto RicanPuget Sound SalishRomanianRussianSalvadoranSamoanScandinavianScotch-IrishScottishSeminoleSenegaleseSerbianShoshoneSierra LeoneanSiouxSlavicSlovakSloveneSomaliSouth AfricanSouth AmericanSouth American IndianSoviet UnionSpaniardSpanishSpanish AmericanSpanish American IndianSri LankanSubsaharan AfricanSudaneseSwedishSwissSyrianTaiwaneseThaiTlingit-HaidaTohono O'OdhamTonganTrinidadian and TobagonianTsimshianTurkishU.S. Virgin IslanderUgandanUkrainianUruguayanUteVenezuelanVietnameseWelshWest IndianYakamaYaquiYugoslavianYumanYup'ikZimbabwean
Immigration
NonimmigrantsImmigrantsAfghanistanAfricaAlbaniaArgentinaArmeniaAsiaAustraliaAustriaBahamasBangladeshBarbadosBelarusBelgiumBelizeBoliviaBosnia and HerzegovinaBrazilBulgariaBurma/MyanmarCabo VerdeCambodiaCameroonCanadaCaribbeanCentral AmericaChileChinaColombiaCongoCosta RicaCroatiaCubaCzechoslovakiaDenmarkDominicaDominican RepublicEastern AfricaEastern AsiaEastern EuropeEcuadorEgyptEl SalvadorEnglandEritreaEthiopiaEuropeFijiFranceGermanyGhanaGreeceGrenadaGuatemalaGuyanaHaitiHondurasHong KongHungaryIndiaIndonesiaIranIraqIrelandIsraelItalyJamaicaJapanJordanKazakhstanKenyaKoreaKuwaitLaosLatin AmericaLatviaLebanonLiberiaLithuaniaMalaysiaMexicoMicronesiaMiddle AfricaMoldovaMoroccoNepalNetherlandsNicaraguaNigeriaNorth AmericaNorth MacedoniaNorthern AfricaNorthern EuropeNorwayOceaniaPakistanPanamaPeruPhilippinesPolandPortugalRomaniaRussiaSaudi ArabiaScotlandSenegalSerbiaSierra LeoneSingaporeSomaliaSouth AfricaSouth AmericaSouth Central AsiaSouth Eastern AsiaSouthern EuropeSpainSri LankaSt. Vincent and the GrenadinesSudanSwedenSwitzerlandSyriaTaiwanThailandTrinidad and TobagoTurkeyUgandaUkraineUruguayUzbekistanVenezuelaVietnamWest IndiesWestern AfricaWestern AsiaWestern EuropeYemenZaireZimbabweAzores
Family Households with Children
Income
Poverty
Unemployment
Labor Participation
Family Structure
Vehicle Availability
Education Level
Disability

Family Households with Children Comparison

Bermudans

Australians

Tragic
Tragic
26.3%
FAMILY HOUSEHOLDS WITH CHILDREN
0.1/ 100
METRIC RATING
306th/ 347
METRIC RANK
26.9%
FAMILY HOUSEHOLDS WITH CHILDREN
2.8/ 100
METRIC RATING
245th/ 347
METRIC RANK

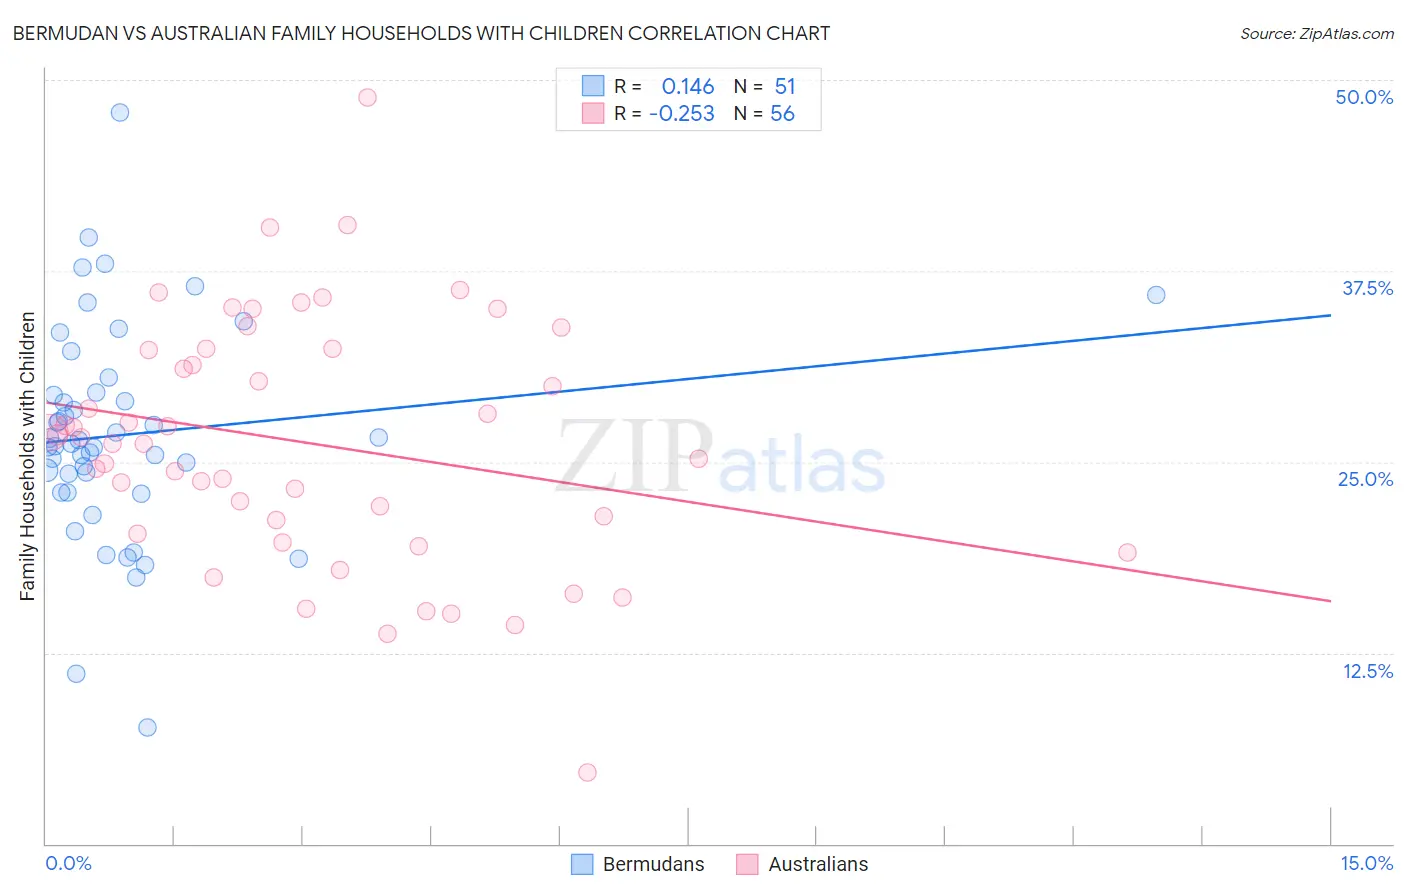
Bermudan vs Australian Family Households with Children Correlation Chart

The statistical analysis conducted on geographies consisting of 55,716,155 people shows a poor positive correlation between the proportion of Bermudans and percentage of family households with children in the United States with a correlation coefficient (R) of 0.146 and weighted average of 26.3%. Similarly, the statistical analysis conducted on geographies consisting of 223,944,645 people shows a weak negative correlation between the proportion of Australians and percentage of family households with children in the United States with a correlation coefficient (R) of -0.253 and weighted average of 26.9%, a difference of 2.2%.
Bermudan vs Australian Family Households with Children

Family Households with Children Correlation Summary

MeasurementBermudanAustralian
Minimum7.6%4.6%
Maximum47.9%48.8%
Range40.3%44.2%
Mean26.8%26.3%
Median26.2%26.4%
Interquartile 25% (IQ1)23.0%20.8%
Interquartile 75% (IQ3)29.6%32.4%
Interquartile Range (IQR)6.5%11.6%
Standard Deviation (Sample)7.1%8.1%
Standard Deviation (Population)7.0%8.0%

Similar Demographics by Family Households with Children

Demographics Similar to Bermudans by Family Households with Children

In terms of family households with children, the demographic groups most similar to Bermudans are Guyanese (26.3%, a difference of 0.010%), Immigrants from Bahamas (26.3%, a difference of 0.040%), West Indian (26.3%, a difference of 0.080%), Immigrants from Guyana (26.3%, a difference of 0.090%), and Lumbee (26.3%, a difference of 0.10%).
DemographicsRating | RankFamily Households with Children
Trinidadians and Tobagonians
0.1
/100
|
#299
Tragic
26.4%
Paiute
0.1
/100
|
#300
Tragic
26.4%
Immigrants | Trinidad and Tobago
0.1
/100
|
#301
Tragic
26.4%
Serbians
0.1
/100
|
#302
Tragic
26.4%
Immigrants | Guyana
0.1
/100
|
#303
Tragic
26.3%
Immigrants | Bahamas
0.1
/100
|
#304
Tragic
26.3%
Guyanese
0.1
/100
|
#305
Tragic
26.3%
Bermudans
0.1
/100
|
#306
Tragic
26.3%
West Indians
0.0
/100
|
#307
Tragic
26.3%
Lumbee
0.0
/100
|
#308
Tragic
26.3%
Immigrants | Somalia
0.0
/100
|
#309
Tragic
26.3%
Marshallese
0.0
/100
|
#310
Tragic
26.2%
Colville
0.0
/100
|
#311
Tragic
26.2%
Immigrants | Czechoslovakia
0.0
/100
|
#312
Tragic
26.2%
Cree
0.0
/100
|
#313
Tragic
26.2%

Demographics Similar to Australians by Family Households with Children

In terms of family households with children, the demographic groups most similar to Australians are Ukrainian (26.9%, a difference of 0.020%), Immigrants from Saudi Arabia (26.9%, a difference of 0.030%), Jamaican (26.9%, a difference of 0.070%), Immigrants from Bulgaria (26.9%, a difference of 0.090%), and Navajo (26.9%, a difference of 0.090%).
DemographicsRating | RankFamily Households with Children
Moroccans
3.4
/100
|
#238
Tragic
26.9%
Immigrants | Southern Europe
3.4
/100
|
#239
Tragic
26.9%
Immigrants | Bulgaria
3.3
/100
|
#240
Tragic
26.9%
Navajo
3.2
/100
|
#241
Tragic
26.9%
Immigrants | England
3.2
/100
|
#242
Tragic
26.9%
Immigrants | Saudi Arabia
2.9
/100
|
#243
Tragic
26.9%
Ukrainians
2.9
/100
|
#244
Tragic
26.9%
Australians
2.8
/100
|
#245
Tragic
26.9%
Jamaicans
2.5
/100
|
#246
Tragic
26.9%
Potawatomi
2.2
/100
|
#247
Tragic
26.9%
Immigrants | Kazakhstan
2.2
/100
|
#248
Tragic
26.9%
Immigrants | Eastern Europe
2.1
/100
|
#249
Tragic
26.9%
Belgians
2.1
/100
|
#250
Tragic
26.9%
Immigrants | Bosnia and Herzegovina
1.9
/100
|
#251
Tragic
26.8%
Irish
1.8
/100
|
#252
Tragic
26.8%