Bermudan vs Australian In Labor Force | Age 16-19
COMPARE
Bermudan
Australian
In Labor Force | Age 16-19
In Labor Force | Age 16-19 Comparison
Bermudans
Australians
36.9%
IN LABOR FORCE | AGE 16-19
69.3/ 100
METRIC RATING
163rd/ 347
METRIC RANK
37.8%
IN LABOR FORCE | AGE 16-19
93.2/ 100
METRIC RATING
136th/ 347
METRIC RANK
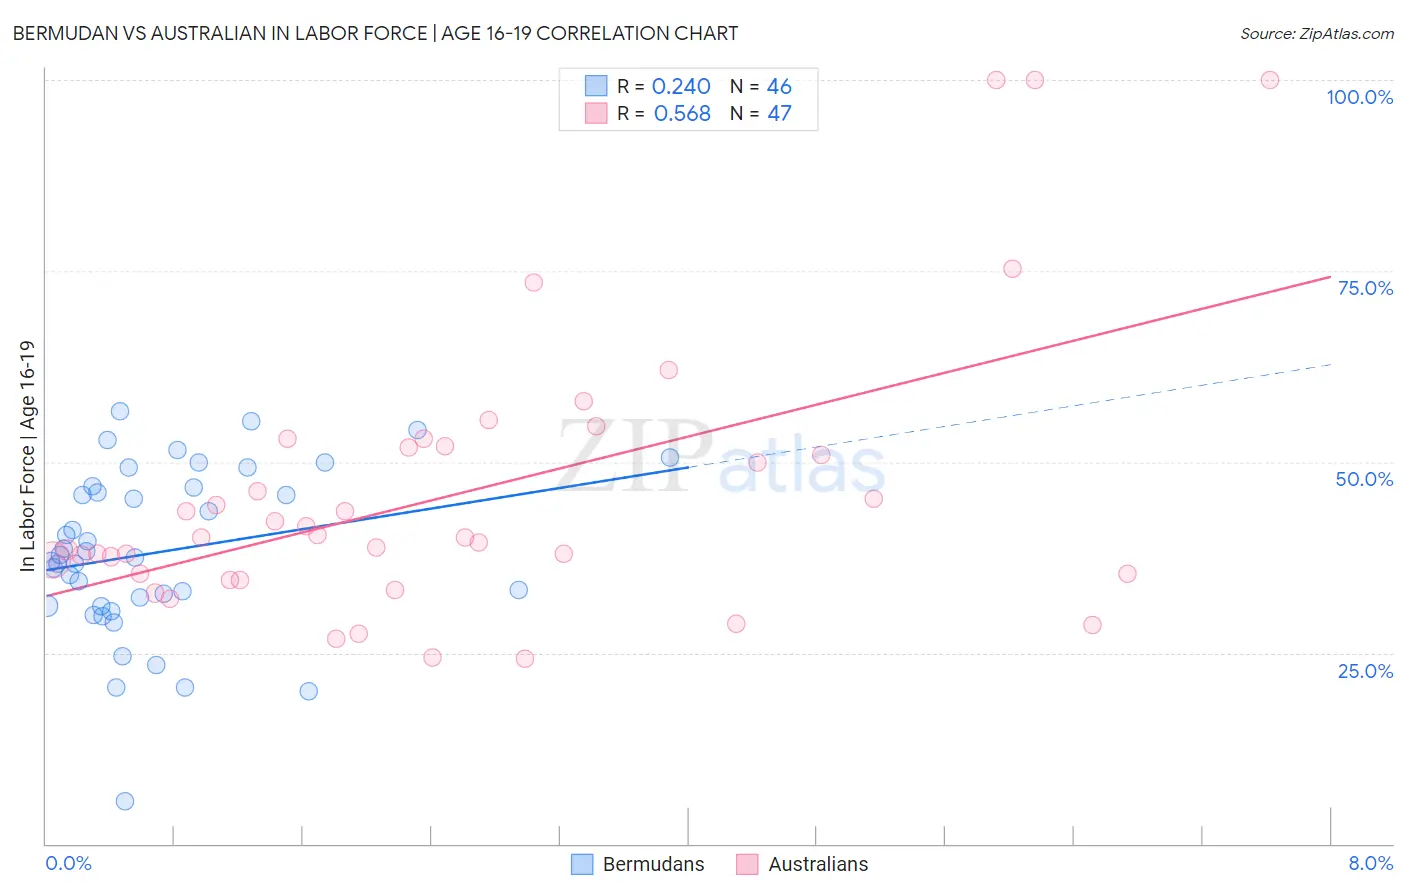
Bermudan vs Australian In Labor Force | Age 16-19 Correlation Chart
The statistical analysis conducted on geographies consisting of 55,701,640 people shows a weak positive correlation between the proportion of Bermudans and labor force participation rate among population between the ages 16 and 19 in the United States with a correlation coefficient (R) of 0.240 and weighted average of 36.9%. Similarly, the statistical analysis conducted on geographies consisting of 223,900,853 people shows a substantial positive correlation between the proportion of Australians and labor force participation rate among population between the ages 16 and 19 in the United States with a correlation coefficient (R) of 0.568 and weighted average of 37.8%, a difference of 2.2%.
In Labor Force | Age 16-19 Correlation Summary
| Measurement | Bermudan | Australian |
| Minimum | 5.6% | 24.2% |
| Maximum | 56.7% | 100.0% |
| Range | 51.1% | 75.8% |
| Mean | 38.2% | 45.9% |
| Median | 37.6% | 40.1% |
| Interquartile 25% (IQ1) | 31.2% | 35.3% |
| Interquartile 75% (IQ3) | 46.6% | 52.1% |
| Interquartile Range (IQR) | 15.4% | 16.8% |
| Standard Deviation (Sample) | 10.9% | 18.1% |
| Standard Deviation (Population) | 10.8% | 17.9% |
Similar Demographics by In Labor Force | Age 16-19
Demographics Similar to Bermudans by In Labor Force | Age 16-19
In terms of in labor force | age 16-19, the demographic groups most similar to Bermudans are Immigrants from Jordan (36.9%, a difference of 0.010%), Immigrants from Kuwait (36.9%, a difference of 0.020%), Cambodian (37.0%, a difference of 0.13%), Yakama (36.9%, a difference of 0.14%), and Immigrants from Western Africa (36.9%, a difference of 0.15%).
| Demographics | Rating | Rank | In Labor Force | Age 16-19 |
| Kiowa | 80.4 /100 | #156 | Excellent 37.2% |
| Immigrants | Brazil | 76.5 /100 | #157 | Good 37.1% |
| Ute | 75.7 /100 | #158 | Good 37.1% |
| Yaqui | 74.4 /100 | #159 | Good 37.1% |
| Immigrants | Saudi Arabia | 73.9 /100 | #160 | Good 37.0% |
| Cambodians | 71.5 /100 | #161 | Good 37.0% |
| Immigrants | Jordan | 69.5 /100 | #162 | Good 36.9% |
| Bermudans | 69.3 /100 | #163 | Good 36.9% |
| Immigrants | Kuwait | 68.9 /100 | #164 | Good 36.9% |
| Yakama | 66.9 /100 | #165 | Good 36.9% |
| Immigrants | Western Africa | 66.7 /100 | #166 | Good 36.9% |
| Arabs | 63.6 /100 | #167 | Good 36.8% |
| Palestinians | 63.1 /100 | #168 | Good 36.8% |
| Immigrants | Latvia | 61.6 /100 | #169 | Good 36.8% |
| Immigrants | South Africa | 60.5 /100 | #170 | Good 36.8% |
Demographics Similar to Australians by In Labor Force | Age 16-19
In terms of in labor force | age 16-19, the demographic groups most similar to Australians are Cajun (37.8%, a difference of 0.0%), Macedonian (37.8%, a difference of 0.030%), Immigrants from Netherlands (37.8%, a difference of 0.090%), Comanche (37.7%, a difference of 0.23%), and Immigrants from Moldova (37.7%, a difference of 0.24%).
| Demographics | Rating | Rank | In Labor Force | Age 16-19 |
| Spaniards | 95.5 /100 | #129 | Exceptional 38.0% |
| Immigrants | Zimbabwe | 95.4 /100 | #130 | Exceptional 38.0% |
| Immigrants | Austria | 95.0 /100 | #131 | Exceptional 37.9% |
| Immigrants | Oceania | 94.7 /100 | #132 | Exceptional 37.9% |
| Cheyenne | 94.6 /100 | #133 | Exceptional 37.9% |
| Immigrants | Netherlands | 93.7 /100 | #134 | Exceptional 37.8% |
| Macedonians | 93.4 /100 | #135 | Exceptional 37.8% |
| Australians | 93.2 /100 | #136 | Exceptional 37.8% |
| Cajuns | 93.2 /100 | #137 | Exceptional 37.8% |
| Comanche | 91.9 /100 | #138 | Exceptional 37.7% |
| Immigrants | Moldova | 91.9 /100 | #139 | Exceptional 37.7% |
| Estonians | 91.7 /100 | #140 | Exceptional 37.7% |
| Syrians | 90.7 /100 | #141 | Exceptional 37.6% |
| Sierra Leoneans | 89.7 /100 | #142 | Excellent 37.6% |
| Pakistanis | 89.5 /100 | #143 | Excellent 37.6% |