Belgian vs Peruvian Median Male Earnings
COMPARE
Belgian
Peruvian
Median Male Earnings
Median Male Earnings Comparison
Belgians
Peruvians
$55,361
MEDIAN MALE EARNINGS
70.1/ 100
METRIC RATING
161st/ 347
METRIC RANK
$55,659
MEDIAN MALE EARNINGS
75.8/ 100
METRIC RATING
152nd/ 347
METRIC RANK
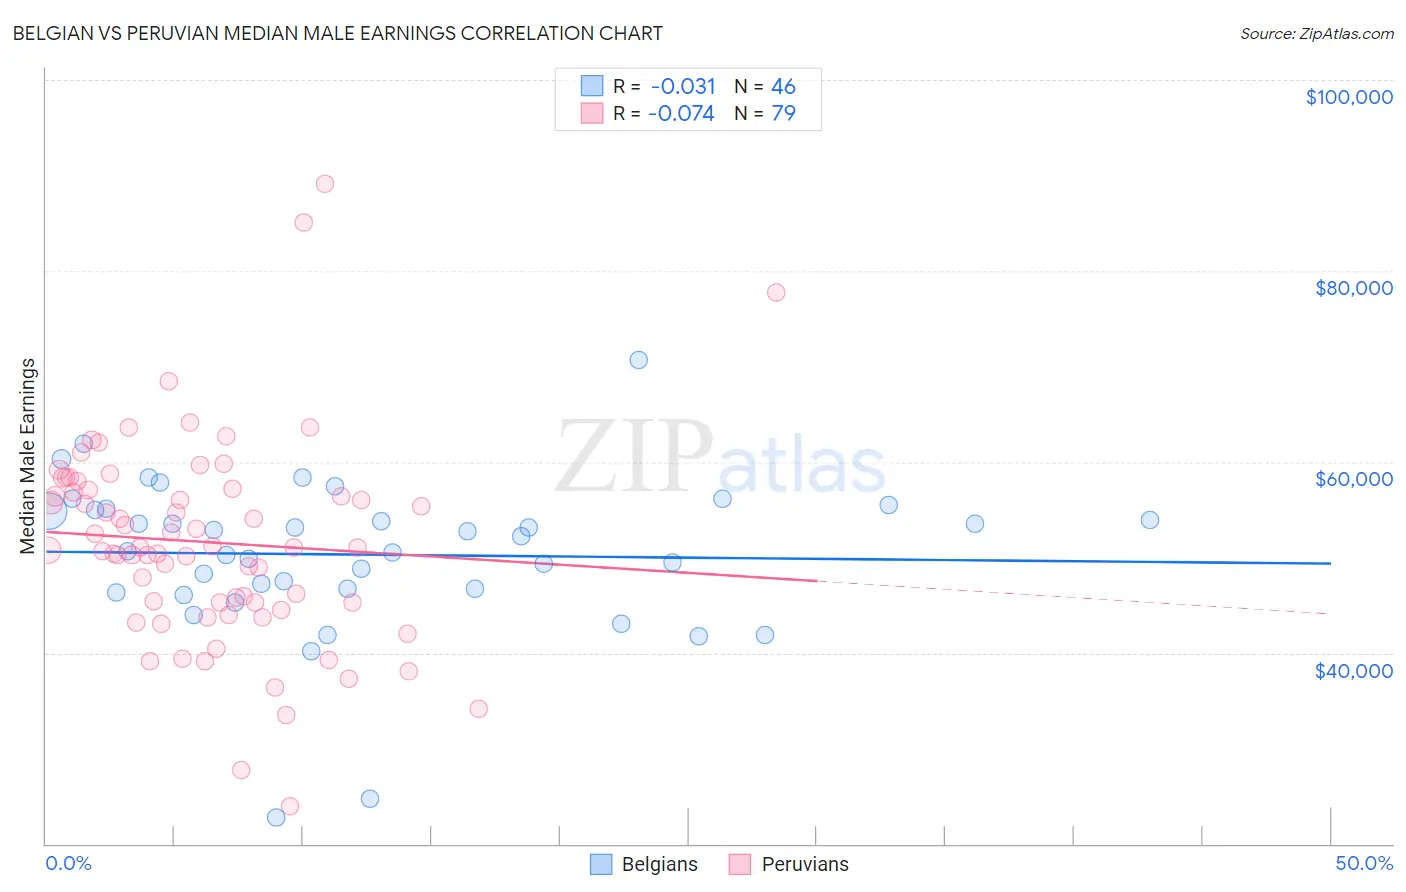
Belgian vs Peruvian Median Male Earnings Correlation Chart
The statistical analysis conducted on geographies consisting of 355,920,572 people shows no correlation between the proportion of Belgians and median male earnings in the United States with a correlation coefficient (R) of -0.031 and weighted average of $55,361. Similarly, the statistical analysis conducted on geographies consisting of 363,195,834 people shows a slight negative correlation between the proportion of Peruvians and median male earnings in the United States with a correlation coefficient (R) of -0.074 and weighted average of $55,659, a difference of 0.54%.
Median Male Earnings Correlation Summary
| Measurement | Belgian | Peruvian |
| Minimum | $22,708 | $23,965 |
| Maximum | $70,714 | $89,196 |
| Range | $48,006 | $65,231 |
| Mean | $50,285 | $51,595 |
| Median | $51,372 | $51,069 |
| Interquartile 25% (IQ1) | $46,719 | $45,232 |
| Interquartile 75% (IQ3) | $54,981 | $57,176 |
| Interquartile Range (IQR) | $8,262 | $11,944 |
| Standard Deviation (Sample) | $8,264 | $10,827 |
| Standard Deviation (Population) | $8,174 | $10,758 |
Demographics Similar to Belgians and Peruvians by Median Male Earnings
In terms of median male earnings, the demographic groups most similar to Belgians are Basque ($55,370, a difference of 0.020%), French ($55,350, a difference of 0.020%), Alsatian ($55,380, a difference of 0.030%), Czechoslovakian ($55,382, a difference of 0.040%), and Icelander ($55,415, a difference of 0.10%). Similarly, the demographic groups most similar to Peruvians are Immigrants from Nepal ($55,615, a difference of 0.080%), Immigrants from Oceania ($55,712, a difference of 0.10%), Swiss ($55,731, a difference of 0.13%), English ($55,747, a difference of 0.16%), and Taiwanese ($55,556, a difference of 0.19%).
| Demographics | Rating | Rank | Median Male Earnings |
| Immigrants | Chile | 80.7 /100 | #146 | Excellent $55,954 |
| Immigrants | Philippines | 78.4 /100 | #147 | Good $55,809 |
| Scottish | 78.2 /100 | #148 | Good $55,793 |
| English | 77.4 /100 | #149 | Good $55,747 |
| Swiss | 77.1 /100 | #150 | Good $55,731 |
| Immigrants | Oceania | 76.8 /100 | #151 | Good $55,712 |
| Peruvians | 75.8 /100 | #152 | Good $55,659 |
| Immigrants | Nepal | 75.0 /100 | #153 | Good $55,615 |
| Taiwanese | 73.9 /100 | #154 | Good $55,556 |
| Scandinavians | 73.4 /100 | #155 | Good $55,527 |
| Immigrants | Ethiopia | 71.6 /100 | #156 | Good $55,434 |
| Icelanders | 71.2 /100 | #157 | Good $55,415 |
| Czechoslovakians | 70.5 /100 | #158 | Good $55,382 |
| Alsatians | 70.5 /100 | #159 | Good $55,380 |
| Basques | 70.3 /100 | #160 | Good $55,370 |
| Belgians | 70.1 /100 | #161 | Good $55,361 |
| French | 69.9 /100 | #162 | Good $55,350 |
| Ugandans | 68.6 /100 | #163 | Good $55,290 |
| Immigrants | South Eastern Asia | 67.6 /100 | #164 | Good $55,241 |
| Immigrants | Portugal | 66.3 /100 | #165 | Good $55,182 |
| Germans | 61.6 /100 | #166 | Good $54,974 |