Belgian vs Immigrants from Nigeria Median Male Earnings
COMPARE
Belgian
Immigrants from Nigeria
Median Male Earnings
Median Male Earnings Comparison
Belgians
Immigrants from Nigeria
$55,361
MEDIAN MALE EARNINGS
70.1/ 100
METRIC RATING
161st/ 347
METRIC RANK
$51,310
MEDIAN MALE EARNINGS
4.2/ 100
METRIC RATING
230th/ 347
METRIC RANK
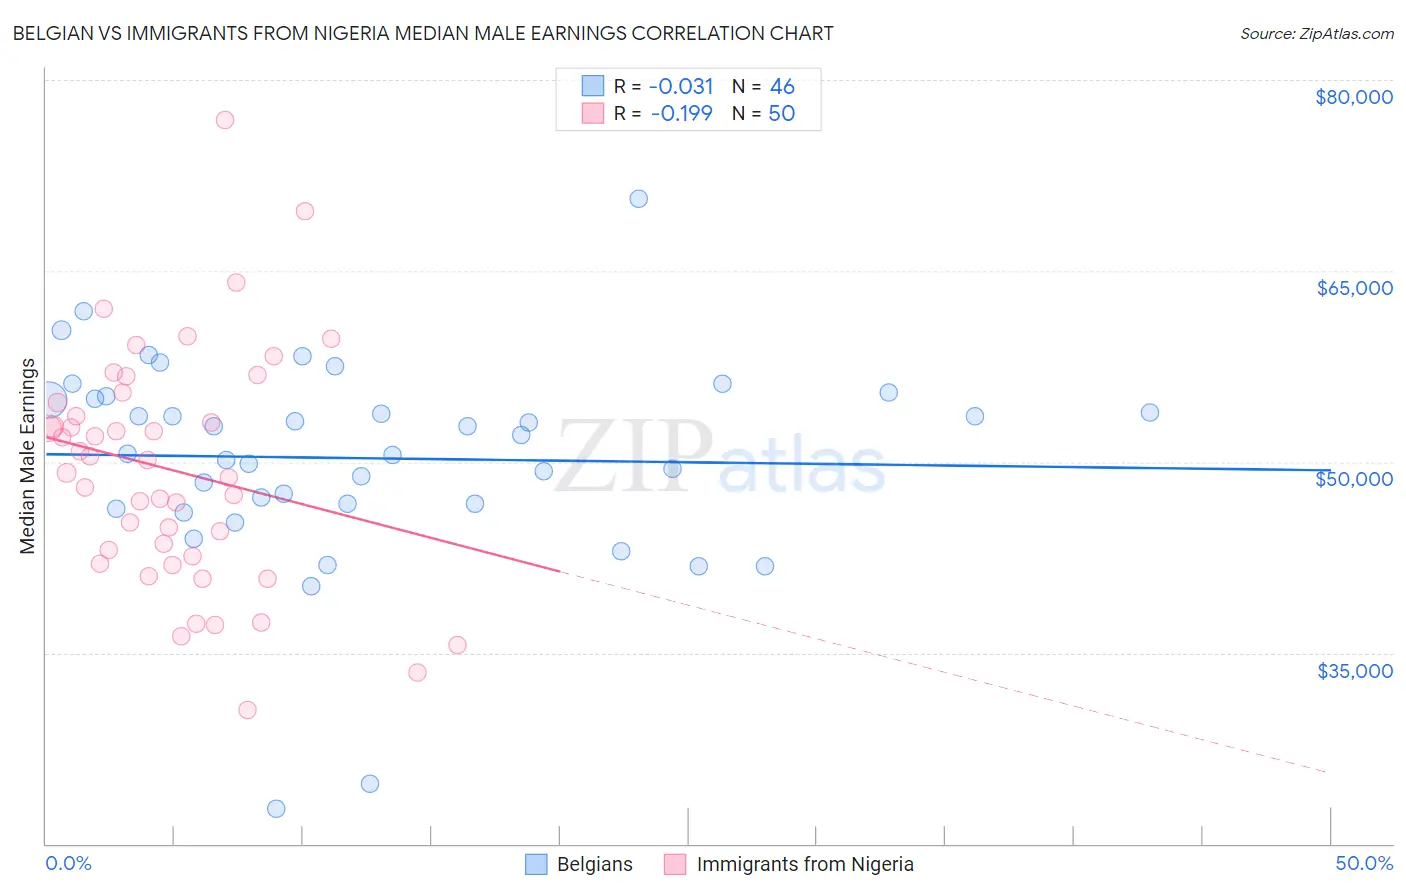
Belgian vs Immigrants from Nigeria Median Male Earnings Correlation Chart
The statistical analysis conducted on geographies consisting of 355,920,572 people shows no correlation between the proportion of Belgians and median male earnings in the United States with a correlation coefficient (R) of -0.031 and weighted average of $55,361. Similarly, the statistical analysis conducted on geographies consisting of 283,479,076 people shows a poor negative correlation between the proportion of Immigrants from Nigeria and median male earnings in the United States with a correlation coefficient (R) of -0.199 and weighted average of $51,310, a difference of 7.9%.
Median Male Earnings Correlation Summary
| Measurement | Belgian | Immigrants from Nigeria |
| Minimum | $22,708 | $30,472 |
| Maximum | $70,714 | $76,820 |
| Range | $48,006 | $46,348 |
| Mean | $50,285 | $49,348 |
| Median | $51,372 | $49,638 |
| Interquartile 25% (IQ1) | $46,719 | $42,561 |
| Interquartile 75% (IQ3) | $54,981 | $54,633 |
| Interquartile Range (IQR) | $8,262 | $12,072 |
| Standard Deviation (Sample) | $8,264 | $9,267 |
| Standard Deviation (Population) | $8,174 | $9,173 |
Similar Demographics by Median Male Earnings
Demographics Similar to Belgians by Median Male Earnings
In terms of median male earnings, the demographic groups most similar to Belgians are Basque ($55,370, a difference of 0.020%), French ($55,350, a difference of 0.020%), Alsatian ($55,380, a difference of 0.030%), Czechoslovakian ($55,382, a difference of 0.040%), and Icelander ($55,415, a difference of 0.10%).
| Demographics | Rating | Rank | Median Male Earnings |
| Taiwanese | 73.9 /100 | #154 | Good $55,556 |
| Scandinavians | 73.4 /100 | #155 | Good $55,527 |
| Immigrants | Ethiopia | 71.6 /100 | #156 | Good $55,434 |
| Icelanders | 71.2 /100 | #157 | Good $55,415 |
| Czechoslovakians | 70.5 /100 | #158 | Good $55,382 |
| Alsatians | 70.5 /100 | #159 | Good $55,380 |
| Basques | 70.3 /100 | #160 | Good $55,370 |
| Belgians | 70.1 /100 | #161 | Good $55,361 |
| French | 69.9 /100 | #162 | Good $55,350 |
| Ugandans | 68.6 /100 | #163 | Good $55,290 |
| Immigrants | South Eastern Asia | 67.6 /100 | #164 | Good $55,241 |
| Immigrants | Portugal | 66.3 /100 | #165 | Good $55,182 |
| Germans | 61.6 /100 | #166 | Good $54,974 |
| Immigrants | Fiji | 61.2 /100 | #167 | Good $54,958 |
| Immigrants | Vietnam | 60.2 /100 | #168 | Good $54,913 |
Demographics Similar to Immigrants from Nigeria by Median Male Earnings
In terms of median male earnings, the demographic groups most similar to Immigrants from Nigeria are Immigrants from Trinidad and Tobago ($51,376, a difference of 0.13%), Barbadian ($51,236, a difference of 0.14%), Samoan ($51,389, a difference of 0.16%), Sudanese ($51,216, a difference of 0.18%), and Trinidadian and Tobagonian ($51,446, a difference of 0.27%).
| Demographics | Rating | Rank | Median Male Earnings |
| Ecuadorians | 5.5 /100 | #223 | Tragic $51,596 |
| Immigrants | Cambodia | 5.5 /100 | #224 | Tragic $51,594 |
| Immigrants | Sudan | 5.0 /100 | #225 | Tragic $51,489 |
| Japanese | 4.9 /100 | #226 | Tragic $51,473 |
| Trinidadians and Tobagonians | 4.8 /100 | #227 | Tragic $51,446 |
| Samoans | 4.6 /100 | #228 | Tragic $51,389 |
| Immigrants | Trinidad and Tobago | 4.5 /100 | #229 | Tragic $51,376 |
| Immigrants | Nigeria | 4.2 /100 | #230 | Tragic $51,310 |
| Barbadians | 3.9 /100 | #231 | Tragic $51,236 |
| Sudanese | 3.9 /100 | #232 | Tragic $51,216 |
| Aleuts | 3.7 /100 | #233 | Tragic $51,168 |
| Cape Verdeans | 3.5 /100 | #234 | Tragic $51,103 |
| Immigrants | Western Africa | 3.0 /100 | #235 | Tragic $50,940 |
| Pennsylvania Germans | 2.8 /100 | #236 | Tragic $50,878 |
| Immigrants | Barbados | 2.6 /100 | #237 | Tragic $50,795 |