Immigrants from Egypt vs Peruvian Median Male Earnings
COMPARE
Immigrants from Egypt
Peruvian
Median Male Earnings
Median Male Earnings Comparison
Immigrants from Egypt
Peruvians
$59,925
MEDIAN MALE EARNINGS
99.5/ 100
METRIC RATING
78th/ 347
METRIC RANK
$55,659
MEDIAN MALE EARNINGS
75.8/ 100
METRIC RATING
152nd/ 347
METRIC RANK
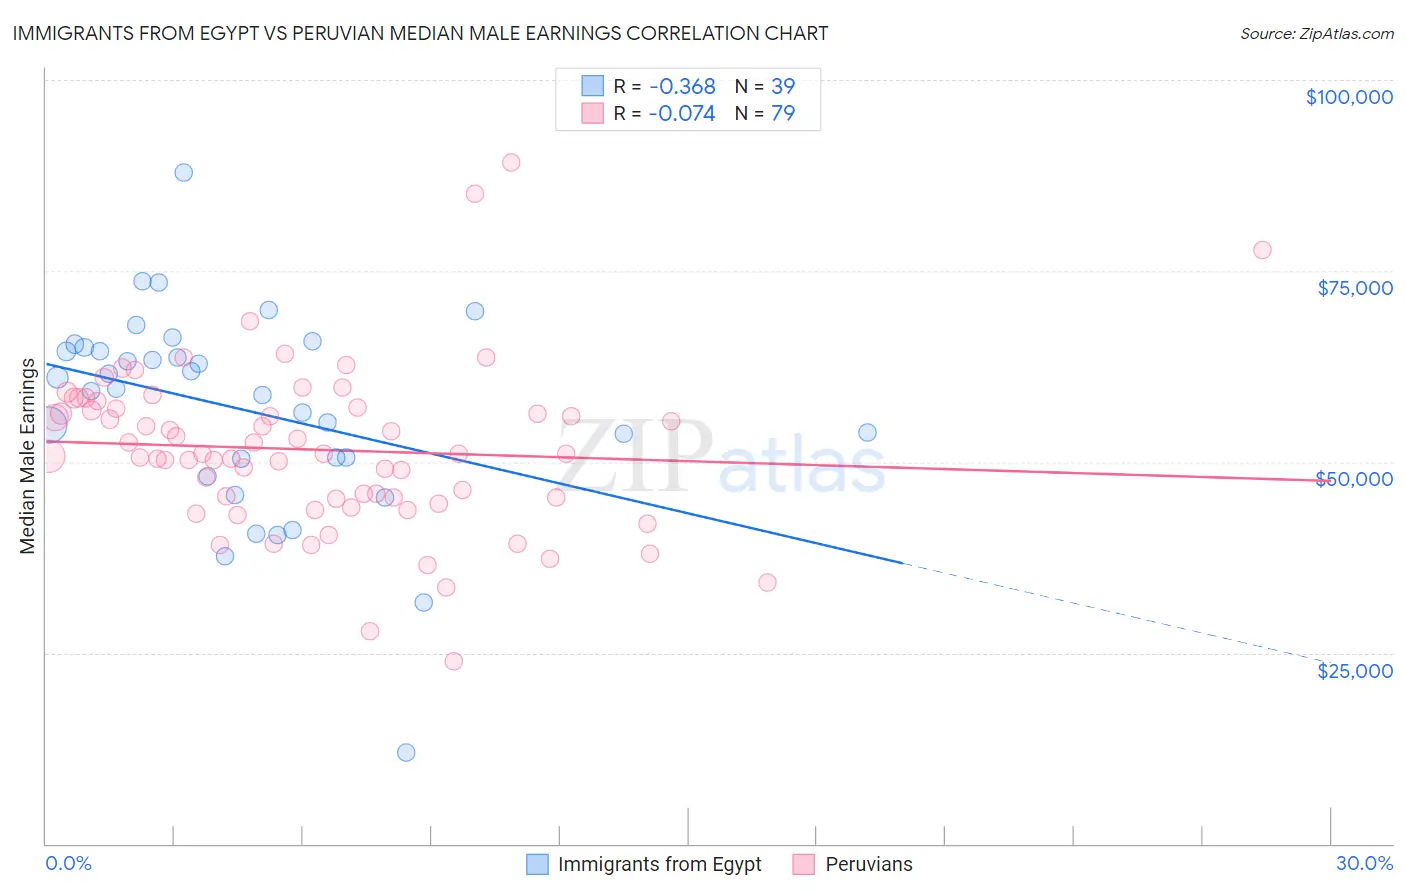
Immigrants from Egypt vs Peruvian Median Male Earnings Correlation Chart
The statistical analysis conducted on geographies consisting of 245,462,607 people shows a mild negative correlation between the proportion of Immigrants from Egypt and median male earnings in the United States with a correlation coefficient (R) of -0.368 and weighted average of $59,925. Similarly, the statistical analysis conducted on geographies consisting of 363,195,834 people shows a slight negative correlation between the proportion of Peruvians and median male earnings in the United States with a correlation coefficient (R) of -0.074 and weighted average of $55,659, a difference of 7.7%.
Median Male Earnings Correlation Summary
| Measurement | Immigrants from Egypt | Peruvian |
| Minimum | $12,000 | $23,965 |
| Maximum | $87,885 | $89,196 |
| Range | $75,885 | $65,231 |
| Mean | $56,843 | $51,595 |
| Median | $59,590 | $51,069 |
| Interquartile 25% (IQ1) | $50,375 | $45,232 |
| Interquartile 75% (IQ3) | $64,984 | $57,176 |
| Interquartile Range (IQR) | $14,609 | $11,944 |
| Standard Deviation (Sample) | $13,509 | $10,827 |
| Standard Deviation (Population) | $13,335 | $10,758 |
Similar Demographics by Median Male Earnings
Demographics Similar to Immigrants from Egypt by Median Male Earnings
In terms of median male earnings, the demographic groups most similar to Immigrants from Egypt are Paraguayan ($59,975, a difference of 0.080%), Immigrants from Ukraine ($59,820, a difference of 0.18%), Immigrants from Hungary ($59,806, a difference of 0.20%), Romanian ($60,063, a difference of 0.23%), and Immigrants from Bolivia ($60,088, a difference of 0.27%).
| Demographics | Rating | Rank | Median Male Earnings |
| Mongolians | 99.7 /100 | #71 | Exceptional $60,350 |
| Immigrants | Western Europe | 99.7 /100 | #72 | Exceptional $60,334 |
| Immigrants | North America | 99.7 /100 | #73 | Exceptional $60,265 |
| Argentineans | 99.6 /100 | #74 | Exceptional $60,117 |
| Immigrants | Bolivia | 99.6 /100 | #75 | Exceptional $60,088 |
| Romanians | 99.6 /100 | #76 | Exceptional $60,063 |
| Paraguayans | 99.5 /100 | #77 | Exceptional $59,975 |
| Immigrants | Egypt | 99.5 /100 | #78 | Exceptional $59,925 |
| Immigrants | Ukraine | 99.5 /100 | #79 | Exceptional $59,820 |
| Immigrants | Hungary | 99.5 /100 | #80 | Exceptional $59,806 |
| Ukrainians | 99.4 /100 | #81 | Exceptional $59,728 |
| Croatians | 99.4 /100 | #82 | Exceptional $59,715 |
| Immigrants | Italy | 99.4 /100 | #83 | Exceptional $59,691 |
| Afghans | 99.3 /100 | #84 | Exceptional $59,554 |
| Italians | 99.3 /100 | #85 | Exceptional $59,551 |
Demographics Similar to Peruvians by Median Male Earnings
In terms of median male earnings, the demographic groups most similar to Peruvians are Immigrants from Nepal ($55,615, a difference of 0.080%), Immigrants from Oceania ($55,712, a difference of 0.10%), Swiss ($55,731, a difference of 0.13%), English ($55,747, a difference of 0.16%), and Taiwanese ($55,556, a difference of 0.19%).
| Demographics | Rating | Rank | Median Male Earnings |
| Norwegians | 80.9 /100 | #145 | Excellent $55,965 |
| Immigrants | Chile | 80.7 /100 | #146 | Excellent $55,954 |
| Immigrants | Philippines | 78.4 /100 | #147 | Good $55,809 |
| Scottish | 78.2 /100 | #148 | Good $55,793 |
| English | 77.4 /100 | #149 | Good $55,747 |
| Swiss | 77.1 /100 | #150 | Good $55,731 |
| Immigrants | Oceania | 76.8 /100 | #151 | Good $55,712 |
| Peruvians | 75.8 /100 | #152 | Good $55,659 |
| Immigrants | Nepal | 75.0 /100 | #153 | Good $55,615 |
| Taiwanese | 73.9 /100 | #154 | Good $55,556 |
| Scandinavians | 73.4 /100 | #155 | Good $55,527 |
| Immigrants | Ethiopia | 71.6 /100 | #156 | Good $55,434 |
| Icelanders | 71.2 /100 | #157 | Good $55,415 |
| Czechoslovakians | 70.5 /100 | #158 | Good $55,382 |
| Alsatians | 70.5 /100 | #159 | Good $55,380 |