Belgian vs Peruvian Householder Income Ages 45 - 64 years
COMPARE
Belgian
Peruvian
Householder Income Ages 45 - 64 years
Householder Income Ages 45 - 64 years Comparison
Belgians
Peruvians
$100,060
HOUSEHOLDER INCOME AGES 45 - 64 YEARS
46.7/ 100
METRIC RATING
179th/ 347
METRIC RANK
$105,070
HOUSEHOLDER INCOME AGES 45 - 64 YEARS
91.5/ 100
METRIC RATING
129th/ 347
METRIC RANK
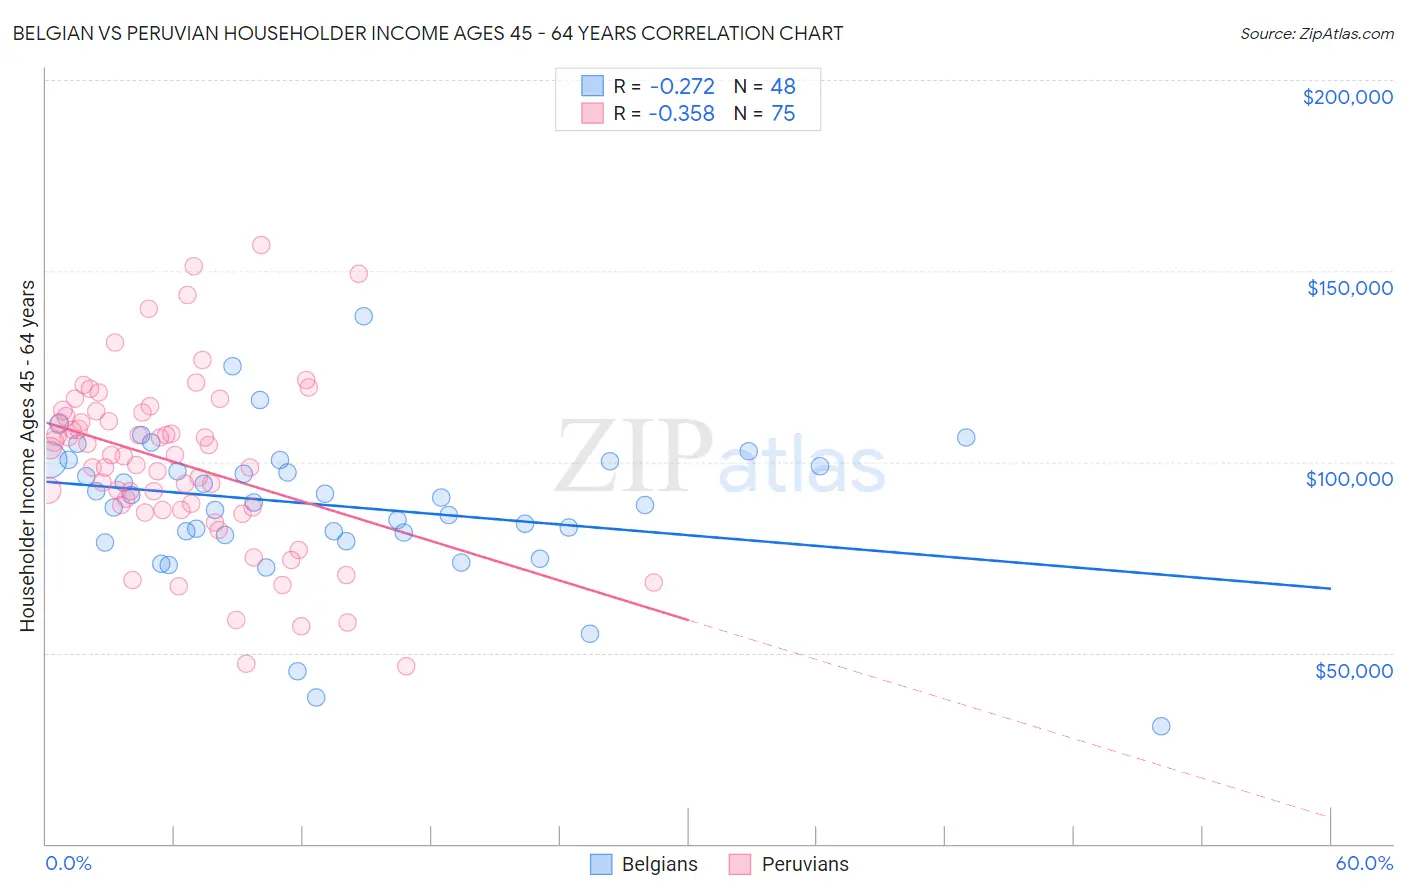
Belgian vs Peruvian Householder Income Ages 45 - 64 years Correlation Chart
The statistical analysis conducted on geographies consisting of 355,498,579 people shows a weak negative correlation between the proportion of Belgians and household income with householder between the ages 45 and 64 in the United States with a correlation coefficient (R) of -0.272 and weighted average of $100,060. Similarly, the statistical analysis conducted on geographies consisting of 362,640,242 people shows a mild negative correlation between the proportion of Peruvians and household income with householder between the ages 45 and 64 in the United States with a correlation coefficient (R) of -0.358 and weighted average of $105,070, a difference of 5.0%.
Householder Income Ages 45 - 64 years Correlation Summary
| Measurement | Belgian | Peruvian |
| Minimum | $30,833 | $46,375 |
| Maximum | $138,162 | $156,818 |
| Range | $107,329 | $110,443 |
| Mean | $88,608 | $99,765 |
| Median | $89,979 | $101,930 |
| Interquartile 25% (IQ1) | $81,216 | $87,436 |
| Interquartile 75% (IQ3) | $100,318 | $112,777 |
| Interquartile Range (IQR) | $19,101 | $25,341 |
| Standard Deviation (Sample) | $19,546 | $22,661 |
| Standard Deviation (Population) | $19,341 | $22,510 |
Similar Demographics by Householder Income Ages 45 - 64 years
Demographics Similar to Belgians by Householder Income Ages 45 - 64 years
In terms of householder income ages 45 - 64 years, the demographic groups most similar to Belgians are Aleut ($100,052, a difference of 0.010%), Immigrants from Cameroon ($100,084, a difference of 0.020%), Immigrants from Costa Rica ($100,141, a difference of 0.080%), Moroccan ($100,138, a difference of 0.080%), and Immigrants ($99,943, a difference of 0.12%).
| Demographics | Rating | Rank | Householder Income Ages 45 - 64 years |
| Immigrants | Uzbekistan | 52.5 /100 | #172 | Average $100,523 |
| Alsatians | 51.4 /100 | #173 | Average $100,435 |
| Welsh | 50.0 /100 | #174 | Average $100,322 |
| Germans | 48.8 /100 | #175 | Average $100,224 |
| Immigrants | Costa Rica | 47.7 /100 | #176 | Average $100,141 |
| Moroccans | 47.7 /100 | #177 | Average $100,138 |
| Immigrants | Cameroon | 47.0 /100 | #178 | Average $100,084 |
| Belgians | 46.7 /100 | #179 | Average $100,060 |
| Aleuts | 46.6 /100 | #180 | Average $100,052 |
| Immigrants | Immigrants | 45.3 /100 | #181 | Average $99,943 |
| Finns | 44.8 /100 | #182 | Average $99,904 |
| Spaniards | 44.6 /100 | #183 | Average $99,889 |
| French | 43.8 /100 | #184 | Average $99,824 |
| Colombians | 43.2 /100 | #185 | Average $99,772 |
| Dutch | 41.7 /100 | #186 | Average $99,650 |
Demographics Similar to Peruvians by Householder Income Ages 45 - 64 years
In terms of householder income ages 45 - 64 years, the demographic groups most similar to Peruvians are Immigrants from Zimbabwe ($104,992, a difference of 0.070%), Native Hawaiian ($105,149, a difference of 0.080%), Immigrants from Saudi Arabia ($105,249, a difference of 0.17%), Immigrants from Syria ($104,858, a difference of 0.20%), and Pakistani ($105,317, a difference of 0.23%).
| Demographics | Rating | Rank | Householder Income Ages 45 - 64 years |
| Immigrants | North Macedonia | 94.2 /100 | #122 | Exceptional $105,892 |
| Danes | 93.4 /100 | #123 | Exceptional $105,619 |
| Immigrants | Northern Africa | 92.8 /100 | #124 | Exceptional $105,430 |
| Pakistanis | 92.4 /100 | #125 | Exceptional $105,317 |
| Portuguese | 92.4 /100 | #126 | Exceptional $105,309 |
| Immigrants | Saudi Arabia | 92.2 /100 | #127 | Exceptional $105,249 |
| Native Hawaiians | 91.8 /100 | #128 | Exceptional $105,149 |
| Peruvians | 91.5 /100 | #129 | Exceptional $105,070 |
| Immigrants | Zimbabwe | 91.2 /100 | #130 | Exceptional $104,992 |
| Immigrants | Syria | 90.7 /100 | #131 | Exceptional $104,858 |
| Lebanese | 90.1 /100 | #132 | Exceptional $104,734 |
| Arabs | 89.3 /100 | #133 | Excellent $104,566 |
| Canadians | 89.3 /100 | #134 | Excellent $104,560 |
| Brazilians | 88.6 /100 | #135 | Excellent $104,408 |
| Taiwanese | 87.4 /100 | #136 | Excellent $104,180 |