Belgian vs Paiute Householder Income Ages 45 - 64 years
COMPARE
Belgian
Paiute
Householder Income Ages 45 - 64 years
Householder Income Ages 45 - 64 years Comparison
Belgians
Paiute
$100,060
HOUSEHOLDER INCOME AGES 45 - 64 YEARS
46.7/ 100
METRIC RATING
179th/ 347
METRIC RANK
$82,629
HOUSEHOLDER INCOME AGES 45 - 64 YEARS
0.0/ 100
METRIC RATING
315th/ 347
METRIC RANK
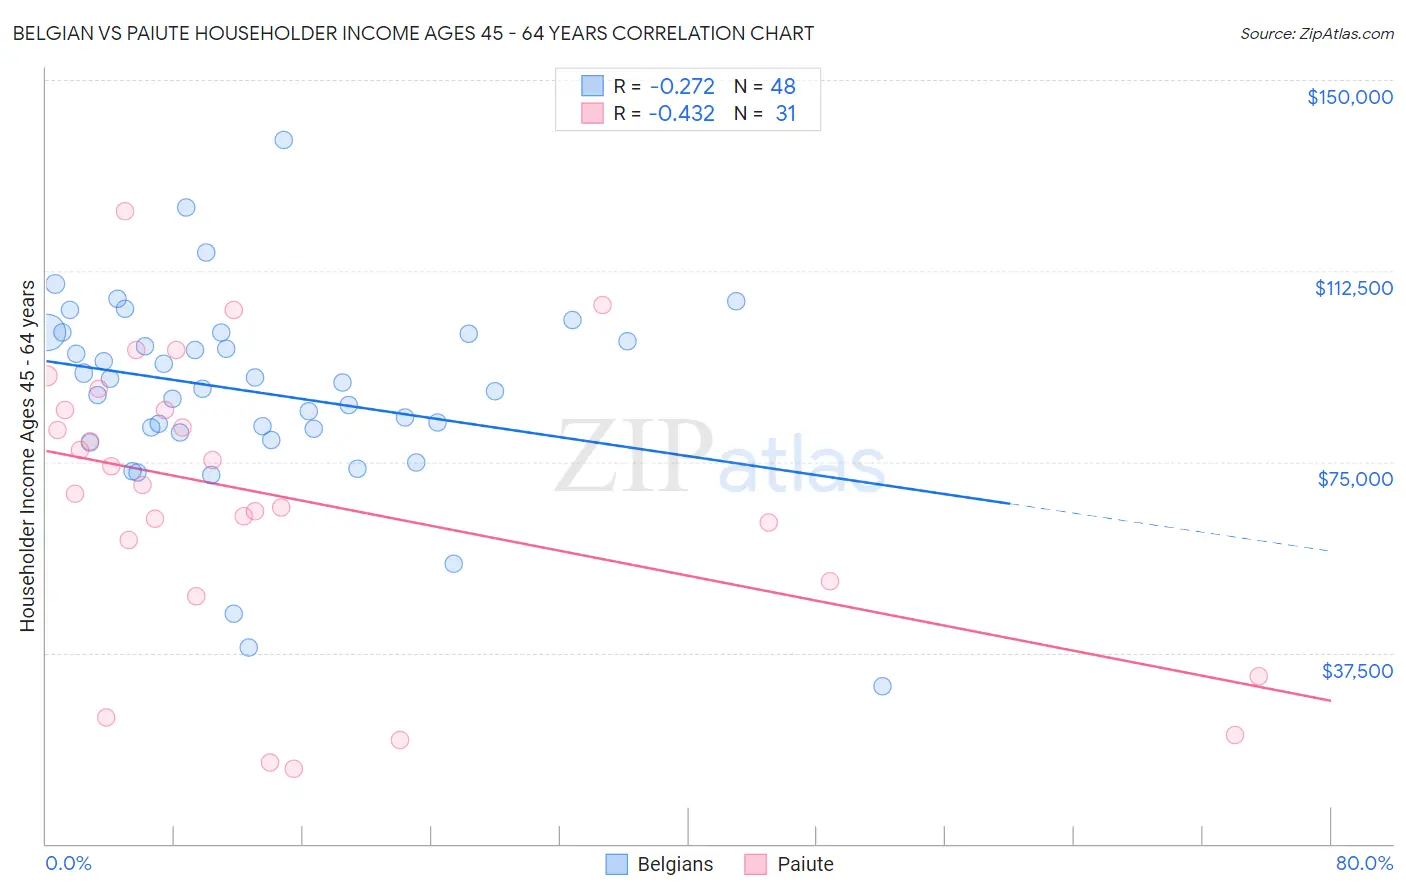
Belgian vs Paiute Householder Income Ages 45 - 64 years Correlation Chart
The statistical analysis conducted on geographies consisting of 355,498,579 people shows a weak negative correlation between the proportion of Belgians and household income with householder between the ages 45 and 64 in the United States with a correlation coefficient (R) of -0.272 and weighted average of $100,060. Similarly, the statistical analysis conducted on geographies consisting of 58,360,777 people shows a moderate negative correlation between the proportion of Paiute and household income with householder between the ages 45 and 64 in the United States with a correlation coefficient (R) of -0.432 and weighted average of $82,629, a difference of 21.1%.
Householder Income Ages 45 - 64 years Correlation Summary
| Measurement | Belgian | Paiute |
| Minimum | $30,833 | $14,844 |
| Maximum | $138,162 | $124,138 |
| Range | $107,329 | $109,294 |
| Mean | $88,608 | $67,796 |
| Median | $89,979 | $70,472 |
| Interquartile 25% (IQ1) | $81,216 | $51,645 |
| Interquartile 75% (IQ3) | $100,318 | $85,268 |
| Interquartile Range (IQR) | $19,101 | $33,623 |
| Standard Deviation (Sample) | $19,546 | $28,134 |
| Standard Deviation (Population) | $19,341 | $27,677 |
Similar Demographics by Householder Income Ages 45 - 64 years
Demographics Similar to Belgians by Householder Income Ages 45 - 64 years
In terms of householder income ages 45 - 64 years, the demographic groups most similar to Belgians are Aleut ($100,052, a difference of 0.010%), Immigrants from Cameroon ($100,084, a difference of 0.020%), Immigrants from Costa Rica ($100,141, a difference of 0.080%), Moroccan ($100,138, a difference of 0.080%), and Immigrants ($99,943, a difference of 0.12%).
| Demographics | Rating | Rank | Householder Income Ages 45 - 64 years |
| Immigrants | Uzbekistan | 52.5 /100 | #172 | Average $100,523 |
| Alsatians | 51.4 /100 | #173 | Average $100,435 |
| Welsh | 50.0 /100 | #174 | Average $100,322 |
| Germans | 48.8 /100 | #175 | Average $100,224 |
| Immigrants | Costa Rica | 47.7 /100 | #176 | Average $100,141 |
| Moroccans | 47.7 /100 | #177 | Average $100,138 |
| Immigrants | Cameroon | 47.0 /100 | #178 | Average $100,084 |
| Belgians | 46.7 /100 | #179 | Average $100,060 |
| Aleuts | 46.6 /100 | #180 | Average $100,052 |
| Immigrants | Immigrants | 45.3 /100 | #181 | Average $99,943 |
| Finns | 44.8 /100 | #182 | Average $99,904 |
| Spaniards | 44.6 /100 | #183 | Average $99,889 |
| French | 43.8 /100 | #184 | Average $99,824 |
| Colombians | 43.2 /100 | #185 | Average $99,772 |
| Dutch | 41.7 /100 | #186 | Average $99,650 |
Demographics Similar to Paiute by Householder Income Ages 45 - 64 years
In terms of householder income ages 45 - 64 years, the demographic groups most similar to Paiute are Immigrants from Honduras ($82,697, a difference of 0.080%), U.S. Virgin Islander ($82,736, a difference of 0.13%), Immigrants from Caribbean ($82,513, a difference of 0.14%), Colville ($82,474, a difference of 0.19%), and Choctaw ($82,287, a difference of 0.42%).
| Demographics | Rating | Rank | Householder Income Ages 45 - 64 years |
| Immigrants | Cabo Verde | 0.0 /100 | #308 | Tragic $83,542 |
| Immigrants | Dominica | 0.0 /100 | #309 | Tragic $83,311 |
| Immigrants | Haiti | 0.0 /100 | #310 | Tragic $83,257 |
| Immigrants | Bahamas | 0.0 /100 | #311 | Tragic $83,177 |
| Cajuns | 0.0 /100 | #312 | Tragic $83,015 |
| U.S. Virgin Islanders | 0.0 /100 | #313 | Tragic $82,736 |
| Immigrants | Honduras | 0.0 /100 | #314 | Tragic $82,697 |
| Paiute | 0.0 /100 | #315 | Tragic $82,629 |
| Immigrants | Caribbean | 0.0 /100 | #316 | Tragic $82,513 |
| Colville | 0.0 /100 | #317 | Tragic $82,474 |
| Choctaw | 0.0 /100 | #318 | Tragic $82,287 |
| Chickasaw | 0.0 /100 | #319 | Tragic $82,193 |
| Apache | 0.0 /100 | #320 | Tragic $82,184 |
| Yuman | 0.0 /100 | #321 | Tragic $82,139 |
| Sioux | 0.0 /100 | #322 | Tragic $81,750 |