Immigrants from West Indies vs Paiute Householder Income Ages 45 - 64 years
COMPARE
Immigrants from West Indies
Paiute
Householder Income Ages 45 - 64 years
Householder Income Ages 45 - 64 years Comparison
Immigrants from West Indies
Paiute
$88,164
HOUSEHOLDER INCOME AGES 45 - 64 YEARS
0.2/ 100
METRIC RATING
266th/ 347
METRIC RANK
$82,629
HOUSEHOLDER INCOME AGES 45 - 64 YEARS
0.0/ 100
METRIC RATING
315th/ 347
METRIC RANK
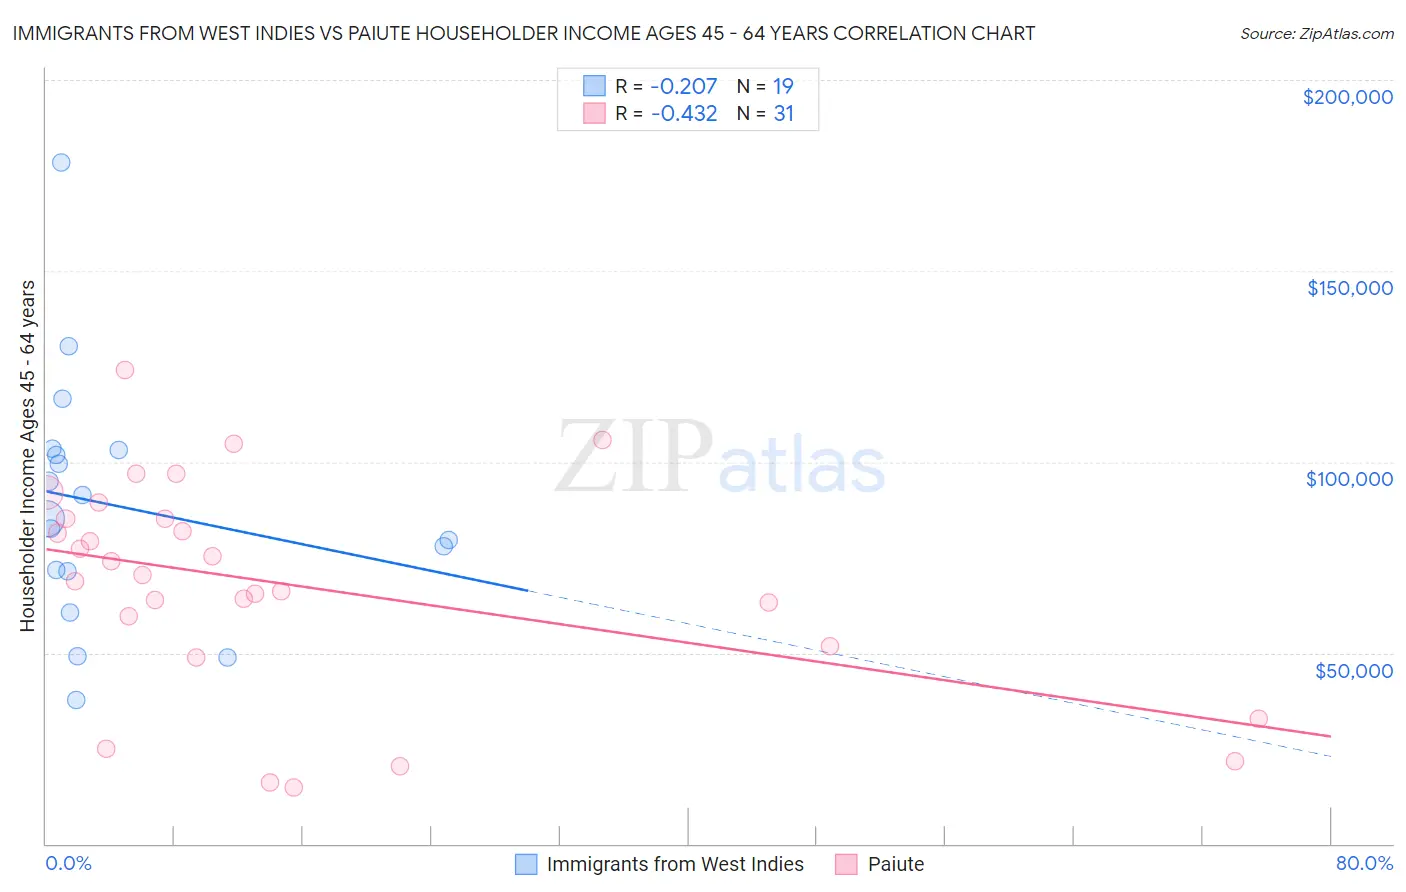
Immigrants from West Indies vs Paiute Householder Income Ages 45 - 64 years Correlation Chart
The statistical analysis conducted on geographies consisting of 72,426,675 people shows a weak negative correlation between the proportion of Immigrants from West Indies and household income with householder between the ages 45 and 64 in the United States with a correlation coefficient (R) of -0.207 and weighted average of $88,164. Similarly, the statistical analysis conducted on geographies consisting of 58,360,777 people shows a moderate negative correlation between the proportion of Paiute and household income with householder between the ages 45 and 64 in the United States with a correlation coefficient (R) of -0.432 and weighted average of $82,629, a difference of 6.7%.
Householder Income Ages 45 - 64 years Correlation Summary
| Measurement | Immigrants from West Indies | Paiute |
| Minimum | $37,750 | $14,844 |
| Maximum | $178,534 | $124,138 |
| Range | $140,784 | $109,294 |
| Mean | $88,607 | $67,796 |
| Median | $84,978 | $70,472 |
| Interquartile 25% (IQ1) | $71,324 | $51,645 |
| Interquartile 75% (IQ3) | $103,214 | $85,268 |
| Interquartile Range (IQR) | $31,890 | $33,623 |
| Standard Deviation (Sample) | $32,229 | $28,134 |
| Standard Deviation (Population) | $31,370 | $27,677 |
Similar Demographics by Householder Income Ages 45 - 64 years
Demographics Similar to Immigrants from West Indies by Householder Income Ages 45 - 64 years
In terms of householder income ages 45 - 64 years, the demographic groups most similar to Immigrants from West Indies are Hmong ($88,115, a difference of 0.050%), Jamaican ($88,327, a difference of 0.19%), Osage ($88,390, a difference of 0.26%), Immigrants from Senegal ($88,421, a difference of 0.29%), and Immigrants from Micronesia ($87,864, a difference of 0.34%).
| Demographics | Rating | Rank | Householder Income Ages 45 - 64 years |
| Immigrants | Nicaragua | 0.4 /100 | #259 | Tragic $89,108 |
| Liberians | 0.3 /100 | #260 | Tragic $88,929 |
| Belizeans | 0.3 /100 | #261 | Tragic $88,684 |
| Somalis | 0.3 /100 | #262 | Tragic $88,600 |
| Immigrants | Senegal | 0.3 /100 | #263 | Tragic $88,421 |
| Osage | 0.3 /100 | #264 | Tragic $88,390 |
| Jamaicans | 0.2 /100 | #265 | Tragic $88,327 |
| Immigrants | West Indies | 0.2 /100 | #266 | Tragic $88,164 |
| Hmong | 0.2 /100 | #267 | Tragic $88,115 |
| Immigrants | Micronesia | 0.2 /100 | #268 | Tragic $87,864 |
| Spanish Americans | 0.2 /100 | #269 | Tragic $87,836 |
| Immigrants | Liberia | 0.2 /100 | #270 | Tragic $87,739 |
| Guatemalans | 0.2 /100 | #271 | Tragic $87,705 |
| Cape Verdeans | 0.2 /100 | #272 | Tragic $87,580 |
| Spanish American Indians | 0.2 /100 | #273 | Tragic $87,561 |
Demographics Similar to Paiute by Householder Income Ages 45 - 64 years
In terms of householder income ages 45 - 64 years, the demographic groups most similar to Paiute are Immigrants from Honduras ($82,697, a difference of 0.080%), U.S. Virgin Islander ($82,736, a difference of 0.13%), Immigrants from Caribbean ($82,513, a difference of 0.14%), Colville ($82,474, a difference of 0.19%), and Choctaw ($82,287, a difference of 0.42%).
| Demographics | Rating | Rank | Householder Income Ages 45 - 64 years |
| Immigrants | Cabo Verde | 0.0 /100 | #308 | Tragic $83,542 |
| Immigrants | Dominica | 0.0 /100 | #309 | Tragic $83,311 |
| Immigrants | Haiti | 0.0 /100 | #310 | Tragic $83,257 |
| Immigrants | Bahamas | 0.0 /100 | #311 | Tragic $83,177 |
| Cajuns | 0.0 /100 | #312 | Tragic $83,015 |
| U.S. Virgin Islanders | 0.0 /100 | #313 | Tragic $82,736 |
| Immigrants | Honduras | 0.0 /100 | #314 | Tragic $82,697 |
| Paiute | 0.0 /100 | #315 | Tragic $82,629 |
| Immigrants | Caribbean | 0.0 /100 | #316 | Tragic $82,513 |
| Colville | 0.0 /100 | #317 | Tragic $82,474 |
| Choctaw | 0.0 /100 | #318 | Tragic $82,287 |
| Chickasaw | 0.0 /100 | #319 | Tragic $82,193 |
| Apache | 0.0 /100 | #320 | Tragic $82,184 |
| Yuman | 0.0 /100 | #321 | Tragic $82,139 |
| Sioux | 0.0 /100 | #322 | Tragic $81,750 |