Immigrants from Hungary vs Paiute Householder Income Ages 45 - 64 years
COMPARE
Immigrants from Hungary
Paiute
Householder Income Ages 45 - 64 years
Householder Income Ages 45 - 64 years Comparison
Immigrants from Hungary
Paiute
$108,267
HOUSEHOLDER INCOME AGES 45 - 64 YEARS
98.2/ 100
METRIC RATING
95th/ 347
METRIC RANK
$82,629
HOUSEHOLDER INCOME AGES 45 - 64 YEARS
0.0/ 100
METRIC RATING
315th/ 347
METRIC RANK
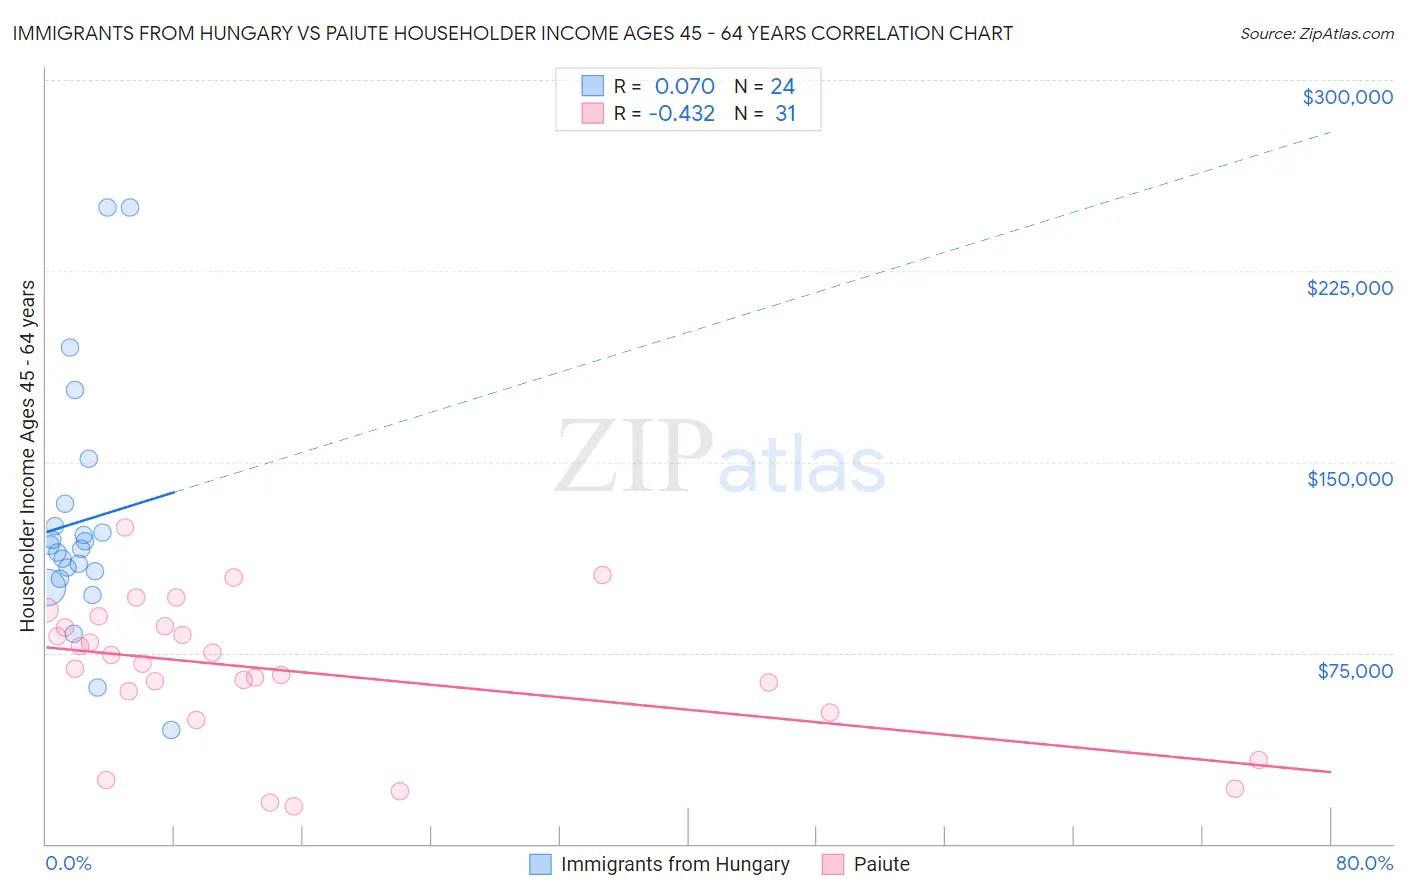
Immigrants from Hungary vs Paiute Householder Income Ages 45 - 64 years Correlation Chart
The statistical analysis conducted on geographies consisting of 195,542,258 people shows a slight positive correlation between the proportion of Immigrants from Hungary and household income with householder between the ages 45 and 64 in the United States with a correlation coefficient (R) of 0.070 and weighted average of $108,267. Similarly, the statistical analysis conducted on geographies consisting of 58,360,777 people shows a moderate negative correlation between the proportion of Paiute and household income with householder between the ages 45 and 64 in the United States with a correlation coefficient (R) of -0.432 and weighted average of $82,629, a difference of 31.0%.
Householder Income Ages 45 - 64 years Correlation Summary
| Measurement | Immigrants from Hungary | Paiute |
| Minimum | $44,685 | $14,844 |
| Maximum | $250,001 | $124,138 |
| Range | $205,316 | $109,294 |
| Mean | $126,709 | $67,796 |
| Median | $116,767 | $70,472 |
| Interquartile 25% (IQ1) | $105,544 | $51,645 |
| Interquartile 75% (IQ3) | $129,142 | $85,268 |
| Interquartile Range (IQR) | $23,598 | $33,623 |
| Standard Deviation (Sample) | $48,913 | $28,134 |
| Standard Deviation (Population) | $47,884 | $27,677 |
Similar Demographics by Householder Income Ages 45 - 64 years
Demographics Similar to Immigrants from Hungary by Householder Income Ages 45 - 64 years
In terms of householder income ages 45 - 64 years, the demographic groups most similar to Immigrants from Hungary are Sri Lankan ($108,270, a difference of 0.0%), Immigrants from Argentina ($108,264, a difference of 0.0%), Immigrants from Croatia ($108,304, a difference of 0.030%), Croatian ($108,383, a difference of 0.11%), and Ukrainian ($108,475, a difference of 0.19%).
| Demographics | Rating | Rank | Householder Income Ages 45 - 64 years |
| Romanians | 98.5 /100 | #88 | Exceptional $108,609 |
| Ukrainians | 98.3 /100 | #89 | Exceptional $108,475 |
| Immigrants | Philippines | 98.3 /100 | #90 | Exceptional $108,471 |
| Immigrants | Lebanon | 98.3 /100 | #91 | Exceptional $108,471 |
| Croatians | 98.3 /100 | #92 | Exceptional $108,383 |
| Immigrants | Croatia | 98.2 /100 | #93 | Exceptional $108,304 |
| Sri Lankans | 98.2 /100 | #94 | Exceptional $108,270 |
| Immigrants | Hungary | 98.2 /100 | #95 | Exceptional $108,267 |
| Immigrants | Argentina | 98.2 /100 | #96 | Exceptional $108,264 |
| Northern Europeans | 97.8 /100 | #97 | Exceptional $107,870 |
| Immigrants | Southern Europe | 97.7 /100 | #98 | Exceptional $107,775 |
| Palestinians | 97.6 /100 | #99 | Exceptional $107,721 |
| Immigrants | Serbia | 97.4 /100 | #100 | Exceptional $107,569 |
| Immigrants | Kazakhstan | 97.2 /100 | #101 | Exceptional $107,378 |
| Immigrants | Moldova | 97.1 /100 | #102 | Exceptional $107,357 |
Demographics Similar to Paiute by Householder Income Ages 45 - 64 years
In terms of householder income ages 45 - 64 years, the demographic groups most similar to Paiute are Immigrants from Honduras ($82,697, a difference of 0.080%), U.S. Virgin Islander ($82,736, a difference of 0.13%), Immigrants from Caribbean ($82,513, a difference of 0.14%), Colville ($82,474, a difference of 0.19%), and Choctaw ($82,287, a difference of 0.42%).
| Demographics | Rating | Rank | Householder Income Ages 45 - 64 years |
| Immigrants | Cabo Verde | 0.0 /100 | #308 | Tragic $83,542 |
| Immigrants | Dominica | 0.0 /100 | #309 | Tragic $83,311 |
| Immigrants | Haiti | 0.0 /100 | #310 | Tragic $83,257 |
| Immigrants | Bahamas | 0.0 /100 | #311 | Tragic $83,177 |
| Cajuns | 0.0 /100 | #312 | Tragic $83,015 |
| U.S. Virgin Islanders | 0.0 /100 | #313 | Tragic $82,736 |
| Immigrants | Honduras | 0.0 /100 | #314 | Tragic $82,697 |
| Paiute | 0.0 /100 | #315 | Tragic $82,629 |
| Immigrants | Caribbean | 0.0 /100 | #316 | Tragic $82,513 |
| Colville | 0.0 /100 | #317 | Tragic $82,474 |
| Choctaw | 0.0 /100 | #318 | Tragic $82,287 |
| Chickasaw | 0.0 /100 | #319 | Tragic $82,193 |
| Apache | 0.0 /100 | #320 | Tragic $82,184 |
| Yuman | 0.0 /100 | #321 | Tragic $82,139 |
| Sioux | 0.0 /100 | #322 | Tragic $81,750 |