Malaysian vs Mongolian Householder Income Ages 45 - 64 years
COMPARE
Malaysian
Mongolian
Householder Income Ages 45 - 64 years
Householder Income Ages 45 - 64 years Comparison
Malaysians
Mongolians
$94,517
HOUSEHOLDER INCOME AGES 45 - 64 YEARS
5.2/ 100
METRIC RATING
222nd/ 347
METRIC RANK
$111,602
HOUSEHOLDER INCOME AGES 45 - 64 YEARS
99.6/ 100
METRIC RATING
63rd/ 347
METRIC RANK
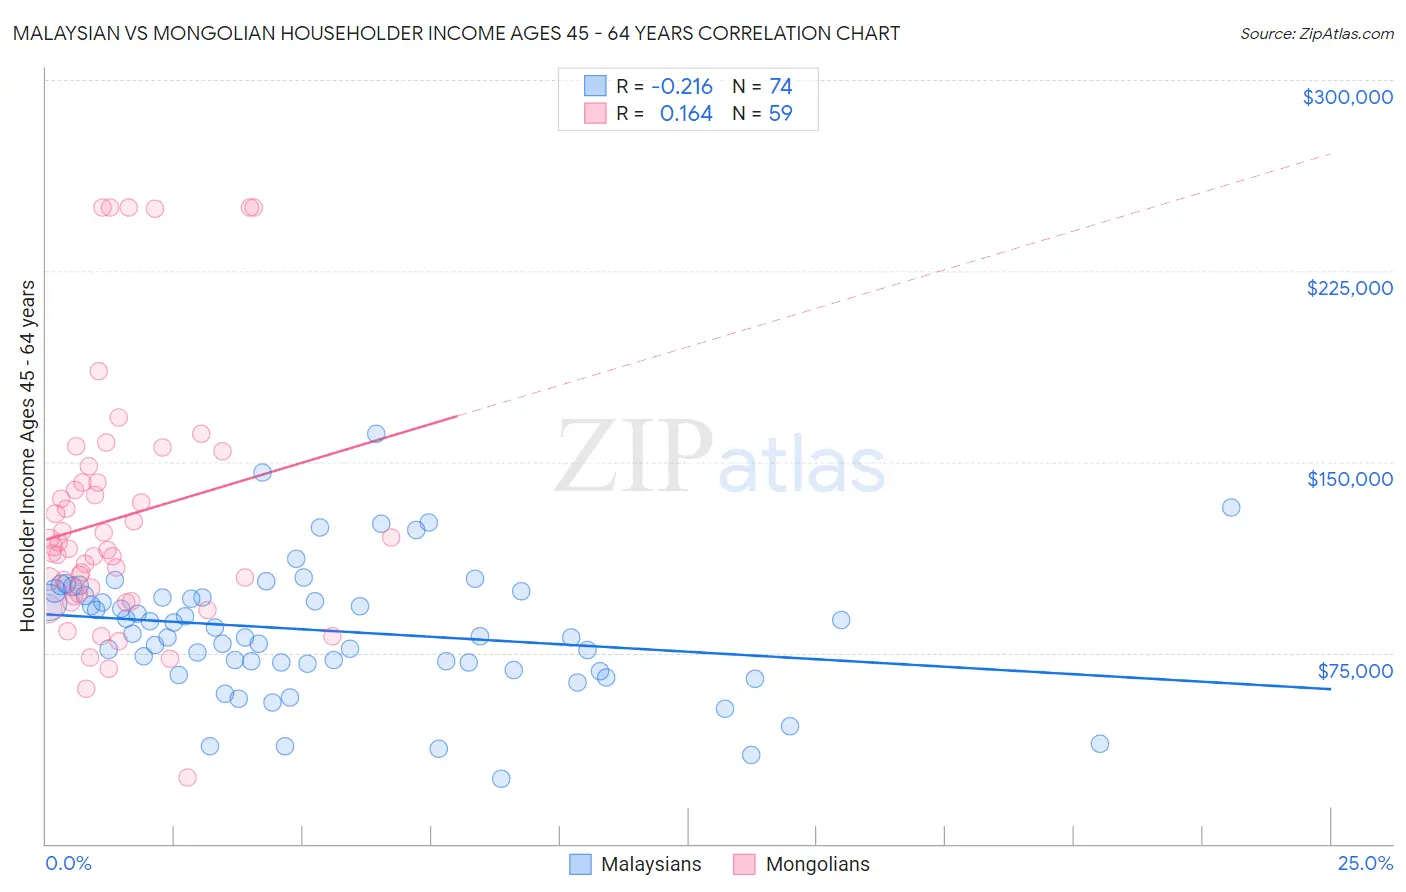
Malaysian vs Mongolian Householder Income Ages 45 - 64 years Correlation Chart
The statistical analysis conducted on geographies consisting of 225,853,925 people shows a weak negative correlation between the proportion of Malaysians and household income with householder between the ages 45 and 64 in the United States with a correlation coefficient (R) of -0.216 and weighted average of $94,517. Similarly, the statistical analysis conducted on geographies consisting of 140,216,470 people shows a poor positive correlation between the proportion of Mongolians and household income with householder between the ages 45 and 64 in the United States with a correlation coefficient (R) of 0.164 and weighted average of $111,602, a difference of 18.1%.
Householder Income Ages 45 - 64 years Correlation Summary
| Measurement | Malaysian | Mongolian |
| Minimum | $25,536 | $25,952 |
| Maximum | $161,017 | $250,001 |
| Range | $135,481 | $224,049 |
| Mean | $83,626 | $127,849 |
| Median | $81,950 | $115,953 |
| Interquartile 25% (IQ1) | $70,625 | $97,273 |
| Interquartile 75% (IQ3) | $97,581 | $142,123 |
| Interquartile Range (IQR) | $26,956 | $44,850 |
| Standard Deviation (Sample) | $25,472 | $50,162 |
| Standard Deviation (Population) | $25,299 | $49,735 |
Similar Demographics by Householder Income Ages 45 - 64 years
Demographics Similar to Malaysians by Householder Income Ages 45 - 64 years
In terms of householder income ages 45 - 64 years, the demographic groups most similar to Malaysians are Nonimmigrants ($94,448, a difference of 0.070%), Immigrants from Bosnia and Herzegovina ($94,288, a difference of 0.24%), Immigrants from Nigeria ($94,804, a difference of 0.30%), Salvadoran ($94,842, a difference of 0.34%), and Bermudan ($94,197, a difference of 0.34%).
| Demographics | Rating | Rank | Householder Income Ages 45 - 64 years |
| Nigerians | 8.2 /100 | #215 | Tragic $95,492 |
| Immigrants | Venezuela | 7.6 /100 | #216 | Tragic $95,342 |
| Immigrants | Ghana | 6.4 /100 | #217 | Tragic $94,982 |
| Delaware | 6.2 /100 | #218 | Tragic $94,914 |
| Immigrants | Armenia | 6.1 /100 | #219 | Tragic $94,863 |
| Salvadorans | 6.0 /100 | #220 | Tragic $94,842 |
| Immigrants | Nigeria | 5.9 /100 | #221 | Tragic $94,804 |
| Malaysians | 5.2 /100 | #222 | Tragic $94,517 |
| Immigrants | Nonimmigrants | 5.0 /100 | #223 | Tragic $94,448 |
| Immigrants | Bosnia and Herzegovina | 4.6 /100 | #224 | Tragic $94,288 |
| Bermudans | 4.4 /100 | #225 | Tragic $94,197 |
| Immigrants | Azores | 4.3 /100 | #226 | Tragic $94,138 |
| Alaska Natives | 4.0 /100 | #227 | Tragic $93,991 |
| Immigrants | Panama | 3.7 /100 | #228 | Tragic $93,815 |
| Vietnamese | 3.6 /100 | #229 | Tragic $93,788 |
Demographics Similar to Mongolians by Householder Income Ages 45 - 64 years
In terms of householder income ages 45 - 64 years, the demographic groups most similar to Mongolians are Immigrants from Norway ($111,669, a difference of 0.060%), Immigrants from Latvia ($111,454, a difference of 0.13%), Immigrants from Belarus ($111,430, a difference of 0.15%), Immigrants from Czechoslovakia ($111,914, a difference of 0.28%), and New Zealander ($111,286, a difference of 0.28%).
| Demographics | Rating | Rank | Householder Income Ages 45 - 64 years |
| Egyptians | 99.7 /100 | #56 | Exceptional $112,256 |
| Immigrants | Scotland | 99.7 /100 | #57 | Exceptional $112,175 |
| Soviet Union | 99.7 /100 | #58 | Exceptional $112,008 |
| Immigrants | Europe | 99.7 /100 | #59 | Exceptional $111,984 |
| Immigrants | Netherlands | 99.7 /100 | #60 | Exceptional $111,982 |
| Immigrants | Czechoslovakia | 99.7 /100 | #61 | Exceptional $111,914 |
| Immigrants | Norway | 99.7 /100 | #62 | Exceptional $111,669 |
| Mongolians | 99.6 /100 | #63 | Exceptional $111,602 |
| Immigrants | Latvia | 99.6 /100 | #64 | Exceptional $111,454 |
| Immigrants | Belarus | 99.6 /100 | #65 | Exceptional $111,430 |
| New Zealanders | 99.6 /100 | #66 | Exceptional $111,286 |
| Laotians | 99.5 /100 | #67 | Exceptional $111,051 |
| Immigrants | Romania | 99.4 /100 | #68 | Exceptional $110,633 |
| Immigrants | Italy | 99.4 /100 | #69 | Exceptional $110,434 |
| Koreans | 99.3 /100 | #70 | Exceptional $110,334 |