Basque vs Immigrants from Portugal Householder Income Over 65 years
COMPARE
Basque
Immigrants from Portugal
Householder Income Over 65 years
Householder Income Over 65 years Comparison
Basques
Immigrants from Portugal
$62,653
HOUSEHOLDER INCOME OVER 65 YEARS
85.4/ 100
METRIC RATING
130th/ 347
METRIC RANK
$55,924
HOUSEHOLDER INCOME OVER 65 YEARS
0.5/ 100
METRIC RATING
251st/ 347
METRIC RANK
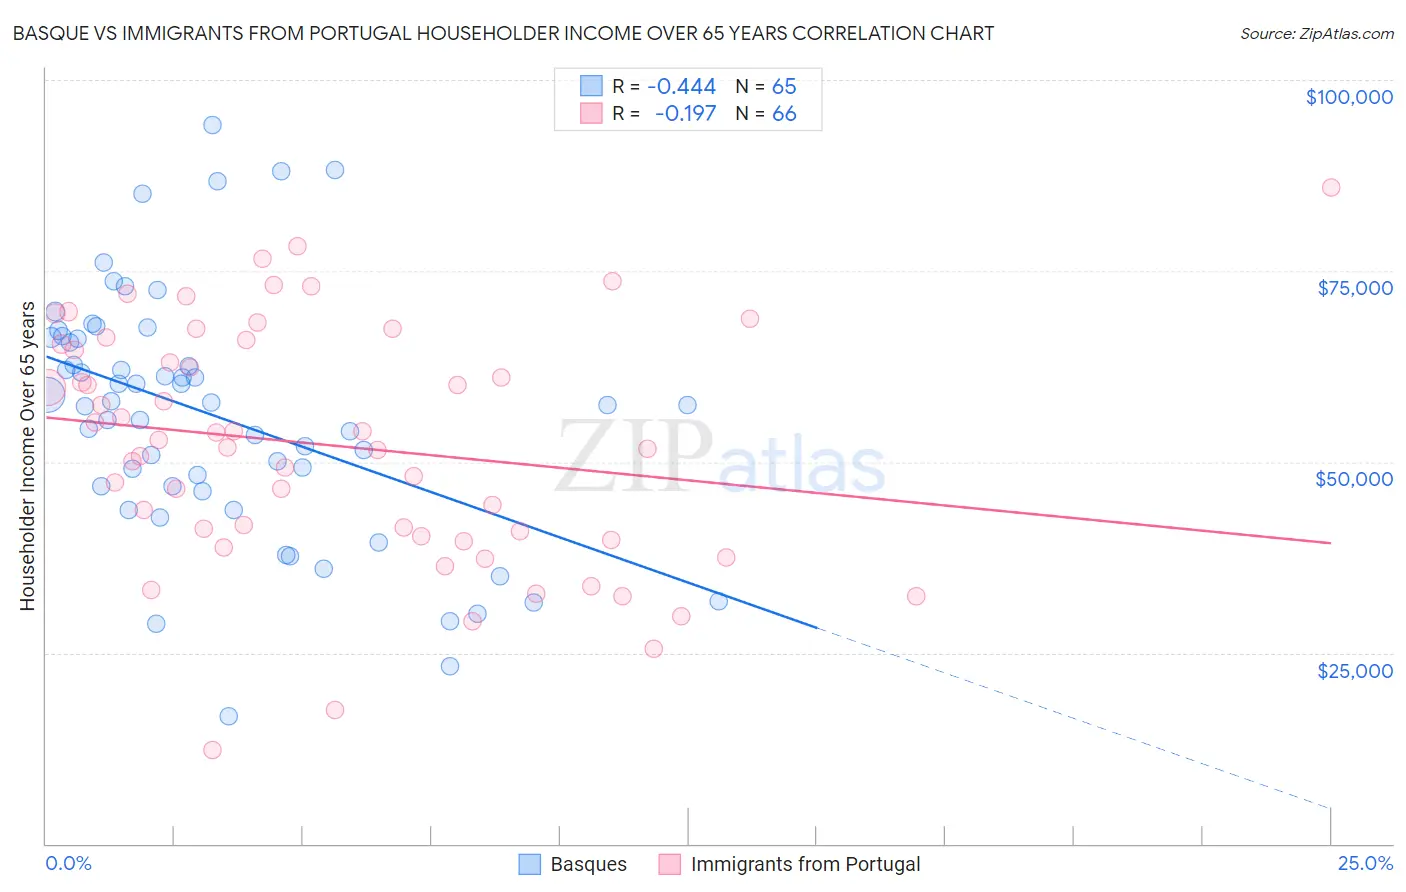
Basque vs Immigrants from Portugal Householder Income Over 65 years Correlation Chart
The statistical analysis conducted on geographies consisting of 165,583,325 people shows a moderate negative correlation between the proportion of Basques and household income with householder over the age of 65 in the United States with a correlation coefficient (R) of -0.444 and weighted average of $62,653. Similarly, the statistical analysis conducted on geographies consisting of 174,564,681 people shows a poor negative correlation between the proportion of Immigrants from Portugal and household income with householder over the age of 65 in the United States with a correlation coefficient (R) of -0.197 and weighted average of $55,924, a difference of 12.0%.
Householder Income Over 65 years Correlation Summary
| Measurement | Basque | Immigrants from Portugal |
| Minimum | $16,667 | $12,293 |
| Maximum | $94,125 | $85,927 |
| Range | $77,458 | $73,634 |
| Mean | $55,918 | $52,138 |
| Median | $57,500 | $52,364 |
| Interquartile 25% (IQ1) | $46,469 | $40,233 |
| Interquartile 75% (IQ3) | $66,222 | $65,422 |
| Interquartile Range (IQR) | $19,753 | $25,189 |
| Standard Deviation (Sample) | $16,196 | $15,656 |
| Standard Deviation (Population) | $16,071 | $15,537 |
Similar Demographics by Householder Income Over 65 years
Demographics Similar to Basques by Householder Income Over 65 years
In terms of householder income over 65 years, the demographic groups most similar to Basques are Immigrants from Western Asia ($62,645, a difference of 0.010%), Immigrants from Eastern Europe ($62,693, a difference of 0.060%), Aleut ($62,708, a difference of 0.090%), Swedish ($62,736, a difference of 0.13%), and Immigrants from Germany ($62,544, a difference of 0.17%).
| Demographics | Rating | Rank | Householder Income Over 65 years |
| Tlingit-Haida | 88.6 /100 | #123 | Excellent $62,922 |
| Taiwanese | 88.3 /100 | #124 | Excellent $62,894 |
| Soviet Union | 87.8 /100 | #125 | Excellent $62,848 |
| Peruvians | 86.8 /100 | #126 | Excellent $62,766 |
| Swedes | 86.4 /100 | #127 | Excellent $62,736 |
| Aleuts | 86.1 /100 | #128 | Excellent $62,708 |
| Immigrants | Eastern Europe | 85.9 /100 | #129 | Excellent $62,693 |
| Basques | 85.4 /100 | #130 | Excellent $62,653 |
| Immigrants | Western Asia | 85.3 /100 | #131 | Excellent $62,645 |
| Immigrants | Germany | 83.9 /100 | #132 | Excellent $62,544 |
| Immigrants | Northern Africa | 83.6 /100 | #133 | Excellent $62,522 |
| Immigrants | Brazil | 81.2 /100 | #134 | Excellent $62,364 |
| Immigrants | Chile | 81.0 /100 | #135 | Excellent $62,354 |
| Alaskan Athabascans | 80.6 /100 | #136 | Excellent $62,330 |
| Immigrants | Syria | 80.2 /100 | #137 | Excellent $62,303 |
Demographics Similar to Immigrants from Portugal by Householder Income Over 65 years
In terms of householder income over 65 years, the demographic groups most similar to Immigrants from Portugal are Immigrants from Bosnia and Herzegovina ($55,986, a difference of 0.11%), Mexican American Indian ($56,089, a difference of 0.30%), Vietnamese ($56,143, a difference of 0.39%), Osage ($55,677, a difference of 0.44%), and Yakama ($56,234, a difference of 0.55%).
| Demographics | Rating | Rank | Householder Income Over 65 years |
| Hmong | 0.8 /100 | #244 | Tragic $56,339 |
| Immigrants | Uzbekistan | 0.8 /100 | #245 | Tragic $56,331 |
| Central Americans | 0.8 /100 | #246 | Tragic $56,321 |
| Yakama | 0.7 /100 | #247 | Tragic $56,234 |
| Vietnamese | 0.6 /100 | #248 | Tragic $56,143 |
| Mexican American Indians | 0.6 /100 | #249 | Tragic $56,089 |
| Immigrants | Bosnia and Herzegovina | 0.5 /100 | #250 | Tragic $55,986 |
| Immigrants | Portugal | 0.5 /100 | #251 | Tragic $55,924 |
| Osage | 0.4 /100 | #252 | Tragic $55,677 |
| Immigrants | Trinidad and Tobago | 0.4 /100 | #253 | Tragic $55,598 |
| Americans | 0.3 /100 | #254 | Tragic $55,527 |
| Immigrants | Bangladesh | 0.3 /100 | #255 | Tragic $55,394 |
| German Russians | 0.3 /100 | #256 | Tragic $55,356 |
| Trinidadians and Tobagonians | 0.3 /100 | #257 | Tragic $55,327 |
| Ecuadorians | 0.2 /100 | #258 | Tragic $54,958 |