Basque vs Liberian Householder Income Ages 45 - 64 years
COMPARE
Basque
Liberian
Householder Income Ages 45 - 64 years
Householder Income Ages 45 - 64 years Comparison
Basques
Liberians
$103,387
HOUSEHOLDER INCOME AGES 45 - 64 YEARS
82.3/ 100
METRIC RATING
147th/ 347
METRIC RANK
$88,929
HOUSEHOLDER INCOME AGES 45 - 64 YEARS
0.3/ 100
METRIC RATING
260th/ 347
METRIC RANK
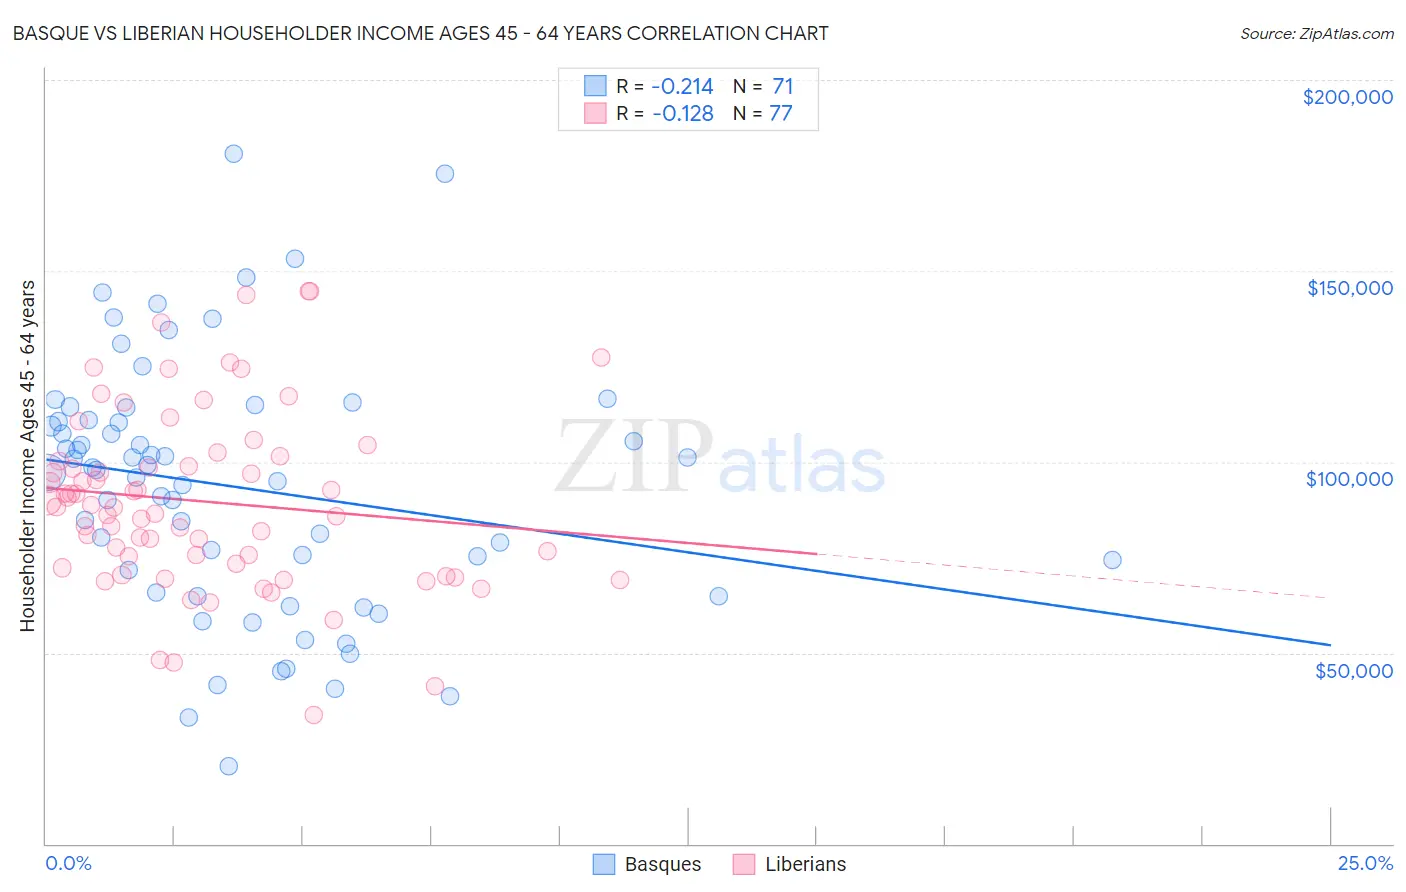
Basque vs Liberian Householder Income Ages 45 - 64 years Correlation Chart
The statistical analysis conducted on geographies consisting of 165,668,497 people shows a weak negative correlation between the proportion of Basques and household income with householder between the ages 45 and 64 in the United States with a correlation coefficient (R) of -0.214 and weighted average of $103,387. Similarly, the statistical analysis conducted on geographies consisting of 117,988,701 people shows a poor negative correlation between the proportion of Liberians and household income with householder between the ages 45 and 64 in the United States with a correlation coefficient (R) of -0.128 and weighted average of $88,929, a difference of 16.3%.
Householder Income Ages 45 - 64 years Correlation Summary
| Measurement | Basque | Liberian |
| Minimum | $20,417 | $33,597 |
| Maximum | $180,563 | $144,731 |
| Range | $160,146 | $111,134 |
| Mean | $93,413 | $89,630 |
| Median | $97,827 | $88,174 |
| Interquartile 25% (IQ1) | $65,865 | $72,788 |
| Interquartile 75% (IQ3) | $110,957 | $100,871 |
| Interquartile Range (IQR) | $45,092 | $28,083 |
| Standard Deviation (Sample) | $33,150 | $23,274 |
| Standard Deviation (Population) | $32,916 | $23,122 |
Similar Demographics by Householder Income Ages 45 - 64 years
Demographics Similar to Basques by Householder Income Ages 45 - 64 years
In terms of householder income ages 45 - 64 years, the demographic groups most similar to Basques are Immigrants from Chile ($103,412, a difference of 0.020%), Ugandan ($103,472, a difference of 0.080%), Immigrants from Germany ($103,282, a difference of 0.10%), Czech ($103,507, a difference of 0.12%), and Serbian ($103,522, a difference of 0.13%).
| Demographics | Rating | Rank | Householder Income Ages 45 - 64 years |
| Norwegians | 84.3 /100 | #140 | Excellent $103,682 |
| Immigrants | Uganda | 83.7 /100 | #141 | Excellent $103,584 |
| Luxembourgers | 83.3 /100 | #142 | Excellent $103,536 |
| Serbians | 83.2 /100 | #143 | Excellent $103,522 |
| Czechs | 83.1 /100 | #144 | Excellent $103,507 |
| Ugandans | 82.9 /100 | #145 | Excellent $103,472 |
| Immigrants | Chile | 82.5 /100 | #146 | Excellent $103,412 |
| Basques | 82.3 /100 | #147 | Excellent $103,387 |
| Immigrants | Germany | 81.5 /100 | #148 | Excellent $103,282 |
| Immigrants | Sierra Leone | 81.1 /100 | #149 | Excellent $103,227 |
| Immigrants | Peru | 80.7 /100 | #150 | Excellent $103,173 |
| Swiss | 79.9 /100 | #151 | Good $103,071 |
| Irish | 79.8 /100 | #152 | Good $103,067 |
| Scandinavians | 79.0 /100 | #153 | Good $102,969 |
| Slovenes | 78.3 /100 | #154 | Good $102,885 |
Demographics Similar to Liberians by Householder Income Ages 45 - 64 years
In terms of householder income ages 45 - 64 years, the demographic groups most similar to Liberians are Immigrants from Nicaragua ($89,108, a difference of 0.20%), Belizean ($88,684, a difference of 0.28%), Somali ($88,600, a difference of 0.37%), Immigrants from Barbados ($89,394, a difference of 0.52%), and German Russian ($89,398, a difference of 0.53%).
| Demographics | Rating | Rank | Householder Income Ages 45 - 64 years |
| Barbadians | 0.6 /100 | #253 | Tragic $90,266 |
| Immigrants | Guyana | 0.6 /100 | #254 | Tragic $90,186 |
| West Indians | 0.5 /100 | #255 | Tragic $89,906 |
| French American Indians | 0.5 /100 | #256 | Tragic $89,811 |
| German Russians | 0.4 /100 | #257 | Tragic $89,398 |
| Immigrants | Barbados | 0.4 /100 | #258 | Tragic $89,394 |
| Immigrants | Nicaragua | 0.4 /100 | #259 | Tragic $89,108 |
| Liberians | 0.3 /100 | #260 | Tragic $88,929 |
| Belizeans | 0.3 /100 | #261 | Tragic $88,684 |
| Somalis | 0.3 /100 | #262 | Tragic $88,600 |
| Immigrants | Senegal | 0.3 /100 | #263 | Tragic $88,421 |
| Osage | 0.3 /100 | #264 | Tragic $88,390 |
| Jamaicans | 0.2 /100 | #265 | Tragic $88,327 |
| Immigrants | West Indies | 0.2 /100 | #266 | Tragic $88,164 |
| Hmong | 0.2 /100 | #267 | Tragic $88,115 |