Barbadian vs Immigrants from Barbados In Labor Force | Age 25-29
COMPARE
Barbadian
Immigrants from Barbados
In Labor Force | Age 25-29
In Labor Force | Age 25-29 Comparison
Barbadians
Immigrants from Barbados
83.9%
IN LABOR FORCE | AGE 25-29
1.0/ 100
METRIC RATING
234th/ 347
METRIC RANK
83.4%
IN LABOR FORCE | AGE 25-29
0.0/ 100
METRIC RATING
269th/ 347
METRIC RANK
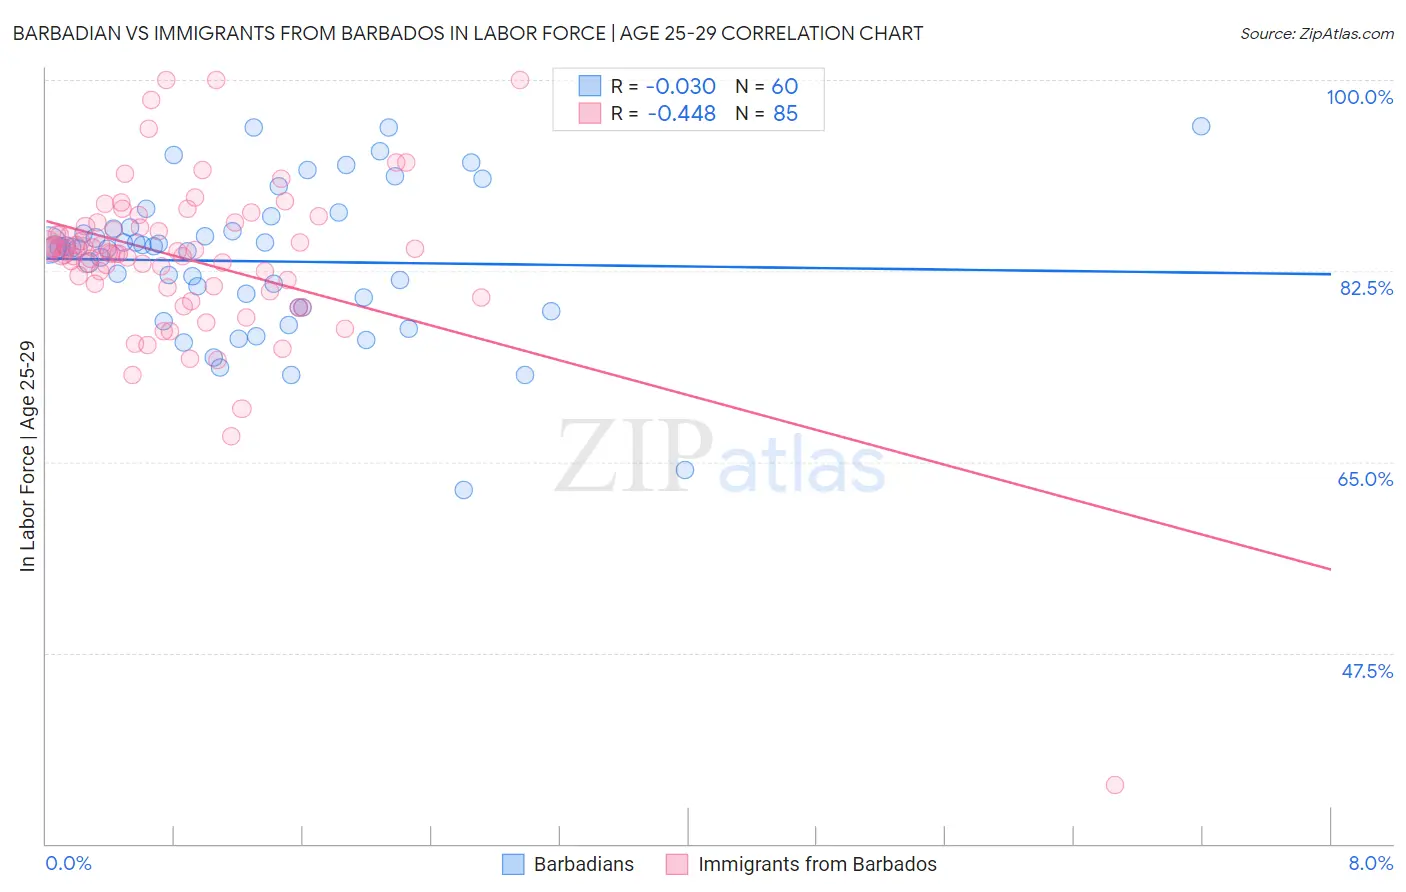
Barbadian vs Immigrants from Barbados In Labor Force | Age 25-29 Correlation Chart
The statistical analysis conducted on geographies consisting of 141,290,733 people shows no correlation between the proportion of Barbadians and labor force participation rate among population between the ages 25 and 29 in the United States with a correlation coefficient (R) of -0.030 and weighted average of 83.9%. Similarly, the statistical analysis conducted on geographies consisting of 112,776,614 people shows a moderate negative correlation between the proportion of Immigrants from Barbados and labor force participation rate among population between the ages 25 and 29 in the United States with a correlation coefficient (R) of -0.448 and weighted average of 83.4%, a difference of 0.63%.
In Labor Force | Age 25-29 Correlation Summary
| Measurement | Barbadian | Immigrants from Barbados |
| Minimum | 62.4% | 35.4% |
| Maximum | 95.8% | 100.0% |
| Range | 33.4% | 64.6% |
| Mean | 83.4% | 83.6% |
| Median | 84.6% | 84.2% |
| Interquartile 25% (IQ1) | 79.2% | 81.1% |
| Interquartile 75% (IQ3) | 86.4% | 86.8% |
| Interquartile Range (IQR) | 7.2% | 5.7% |
| Standard Deviation (Sample) | 6.9% | 8.0% |
| Standard Deviation (Population) | 6.8% | 7.9% |
Similar Demographics by In Labor Force | Age 25-29
Demographics Similar to Barbadians by In Labor Force | Age 25-29
In terms of in labor force | age 25-29, the demographic groups most similar to Barbadians are Iraqi (83.9%, a difference of 0.020%), Guamanian/Chamorro (83.9%, a difference of 0.020%), Immigrants (83.9%, a difference of 0.030%), Immigrants from Uzbekistan (83.9%, a difference of 0.050%), and Jamaican (83.9%, a difference of 0.060%).
| Demographics | Rating | Rank | In Labor Force | Age 25-29 |
| French American Indians | 5.5 /100 | #227 | Tragic 84.2% |
| Immigrants | Panama | 5.5 /100 | #228 | Tragic 84.2% |
| Immigrants | Oceania | 5.0 /100 | #229 | Tragic 84.2% |
| Whites/Caucasians | 4.8 /100 | #230 | Tragic 84.2% |
| Immigrants | Philippines | 4.7 /100 | #231 | Tragic 84.2% |
| Panamanians | 4.5 /100 | #232 | Tragic 84.2% |
| Immigrants | Western Asia | 2.7 /100 | #233 | Tragic 84.1% |
| Barbadians | 1.0 /100 | #234 | Tragic 83.9% |
| Iraqis | 0.9 /100 | #235 | Tragic 83.9% |
| Guamanians/Chamorros | 0.9 /100 | #236 | Tragic 83.9% |
| Immigrants | Immigrants | 0.9 /100 | #237 | Tragic 83.9% |
| Immigrants | Uzbekistan | 0.8 /100 | #238 | Tragic 83.9% |
| Jamaicans | 0.8 /100 | #239 | Tragic 83.9% |
| Trinidadians and Tobagonians | 0.7 /100 | #240 | Tragic 83.9% |
| Alsatians | 0.7 /100 | #241 | Tragic 83.9% |
Demographics Similar to Immigrants from Barbados by In Labor Force | Age 25-29
In terms of in labor force | age 25-29, the demographic groups most similar to Immigrants from Barbados are Immigrants from Lebanon (83.4%, a difference of 0.0%), Spanish American (83.4%, a difference of 0.010%), Basque (83.4%, a difference of 0.010%), Aleut (83.4%, a difference of 0.020%), and Honduran (83.4%, a difference of 0.040%).
| Demographics | Rating | Rank | In Labor Force | Age 25-29 |
| Immigrants | Fiji | 0.1 /100 | #262 | Tragic 83.6% |
| West Indians | 0.1 /100 | #263 | Tragic 83.5% |
| Puget Sound Salish | 0.1 /100 | #264 | Tragic 83.5% |
| Cubans | 0.1 /100 | #265 | Tragic 83.5% |
| Aleuts | 0.0 /100 | #266 | Tragic 83.4% |
| Spanish Americans | 0.0 /100 | #267 | Tragic 83.4% |
| Immigrants | Lebanon | 0.0 /100 | #268 | Tragic 83.4% |
| Immigrants | Barbados | 0.0 /100 | #269 | Tragic 83.4% |
| Basques | 0.0 /100 | #270 | Tragic 83.4% |
| Hondurans | 0.0 /100 | #271 | Tragic 83.4% |
| Immigrants | Caribbean | 0.0 /100 | #272 | Tragic 83.4% |
| Immigrants | Dominica | 0.0 /100 | #273 | Tragic 83.4% |
| Marshallese | 0.0 /100 | #274 | Tragic 83.3% |
| Samoans | 0.0 /100 | #275 | Tragic 83.3% |
| Immigrants | Honduras | 0.0 /100 | #276 | Tragic 83.3% |