Bahamian vs Sioux Householder Income Over 65 years
COMPARE
Bahamian
Sioux
Householder Income Over 65 years
Householder Income Over 65 years Comparison
Bahamians
Sioux
$51,000
HOUSEHOLDER INCOME OVER 65 YEARS
0.0/ 100
METRIC RATING
327th/ 347
METRIC RANK
$52,509
HOUSEHOLDER INCOME OVER 65 YEARS
0.0/ 100
METRIC RATING
310th/ 347
METRIC RANK
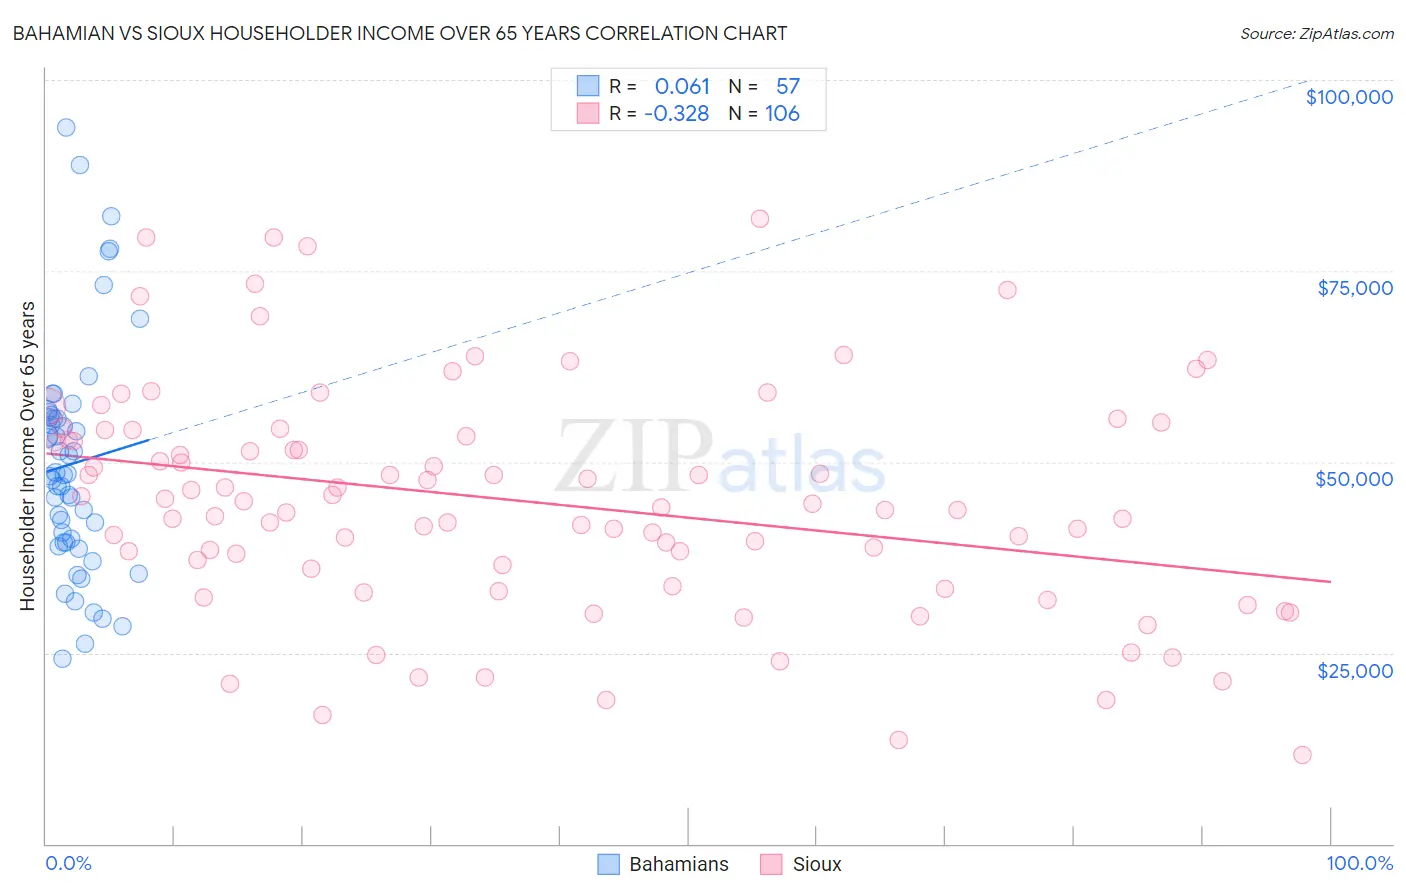
Bahamian vs Sioux Householder Income Over 65 years Correlation Chart
The statistical analysis conducted on geographies consisting of 112,449,613 people shows a slight positive correlation between the proportion of Bahamians and household income with householder over the age of 65 in the United States with a correlation coefficient (R) of 0.061 and weighted average of $51,000. Similarly, the statistical analysis conducted on geographies consisting of 233,494,495 people shows a mild negative correlation between the proportion of Sioux and household income with householder over the age of 65 in the United States with a correlation coefficient (R) of -0.328 and weighted average of $52,509, a difference of 3.0%.
Householder Income Over 65 years Correlation Summary
| Measurement | Bahamian | Sioux |
| Minimum | $24,158 | $11,667 |
| Maximum | $93,779 | $81,875 |
| Range | $69,621 | $70,208 |
| Mean | $49,773 | $44,773 |
| Median | $48,251 | $44,286 |
| Interquartile 25% (IQ1) | $39,444 | $36,021 |
| Interquartile 75% (IQ3) | $55,975 | $53,333 |
| Interquartile Range (IQR) | $16,531 | $17,312 |
| Standard Deviation (Sample) | $14,935 | $14,854 |
| Standard Deviation (Population) | $14,804 | $14,783 |
Demographics Similar to Bahamians and Sioux by Householder Income Over 65 years
In terms of householder income over 65 years, the demographic groups most similar to Bahamians are Hopi ($50,925, a difference of 0.15%), Kiowa ($51,140, a difference of 0.28%), Immigrants from Haiti ($51,219, a difference of 0.43%), Immigrants from Congo ($51,393, a difference of 0.77%), and Cajun ($51,397, a difference of 0.78%). Similarly, the demographic groups most similar to Sioux are Honduran ($52,634, a difference of 0.24%), Seminole ($52,373, a difference of 0.26%), Immigrants from Mexico ($52,801, a difference of 0.56%), Immigrants from the Azores ($52,121, a difference of 0.74%), and Immigrants from Nicaragua ($52,085, a difference of 0.81%).
| Demographics | Rating | Rank | Householder Income Over 65 years |
| Immigrants | Mexico | 0.0 /100 | #308 | Tragic $52,801 |
| Hondurans | 0.0 /100 | #309 | Tragic $52,634 |
| Sioux | 0.0 /100 | #310 | Tragic $52,509 |
| Seminole | 0.0 /100 | #311 | Tragic $52,373 |
| Immigrants | Azores | 0.0 /100 | #312 | Tragic $52,121 |
| Immigrants | Nicaragua | 0.0 /100 | #313 | Tragic $52,085 |
| Natives/Alaskans | 0.0 /100 | #314 | Tragic $52,081 |
| U.S. Virgin Islanders | 0.0 /100 | #315 | Tragic $52,072 |
| Creek | 0.0 /100 | #316 | Tragic $51,949 |
| Immigrants | St. Vincent and the Grenadines | 0.0 /100 | #317 | Tragic $51,922 |
| Haitians | 0.0 /100 | #318 | Tragic $51,912 |
| Immigrants | Honduras | 0.0 /100 | #319 | Tragic $51,888 |
| Colville | 0.0 /100 | #320 | Tragic $51,739 |
| Menominee | 0.0 /100 | #321 | Tragic $51,719 |
| British West Indians | 0.0 /100 | #322 | Tragic $51,463 |
| Cajuns | 0.0 /100 | #323 | Tragic $51,397 |
| Immigrants | Congo | 0.0 /100 | #324 | Tragic $51,393 |
| Immigrants | Haiti | 0.0 /100 | #325 | Tragic $51,219 |
| Kiowa | 0.0 /100 | #326 | Tragic $51,140 |
| Bahamians | 0.0 /100 | #327 | Tragic $51,000 |
| Hopi | 0.0 /100 | #328 | Tragic $50,925 |