Bahamian vs Immigrants from Germany Householder Income Over 65 years
COMPARE
Bahamian
Immigrants from Germany
Householder Income Over 65 years
Householder Income Over 65 years Comparison
Bahamians
Immigrants from Germany
$51,000
HOUSEHOLDER INCOME OVER 65 YEARS
0.0/ 100
METRIC RATING
327th/ 347
METRIC RANK
$62,544
HOUSEHOLDER INCOME OVER 65 YEARS
83.9/ 100
METRIC RATING
132nd/ 347
METRIC RANK
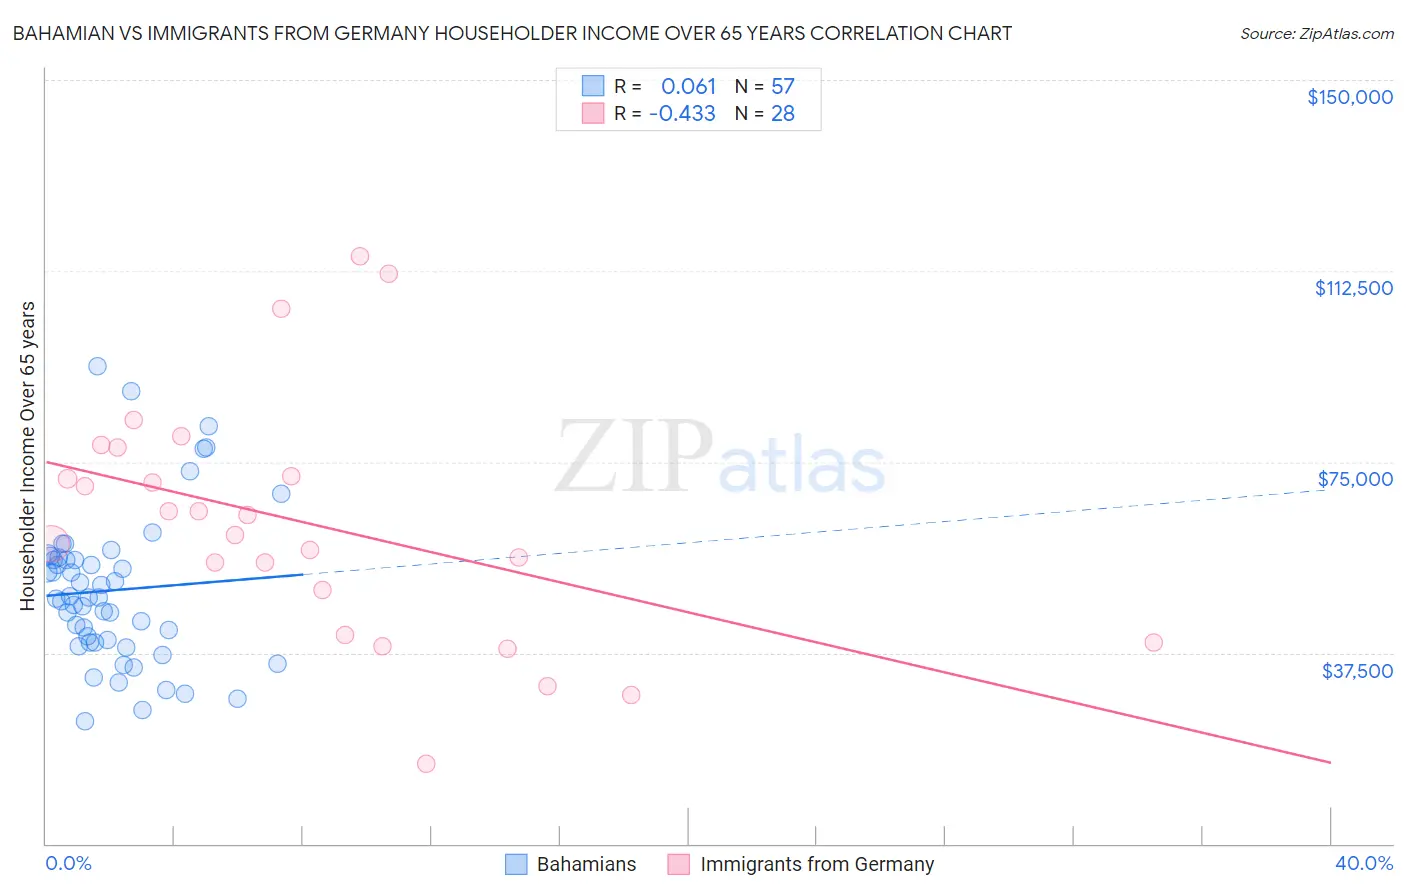
Bahamian vs Immigrants from Germany Householder Income Over 65 years Correlation Chart
The statistical analysis conducted on geographies consisting of 112,449,613 people shows a slight positive correlation between the proportion of Bahamians and household income with householder over the age of 65 in the United States with a correlation coefficient (R) of 0.061 and weighted average of $51,000. Similarly, the statistical analysis conducted on geographies consisting of 462,250,786 people shows a moderate negative correlation between the proportion of Immigrants from Germany and household income with householder over the age of 65 in the United States with a correlation coefficient (R) of -0.433 and weighted average of $62,544, a difference of 22.6%.
Householder Income Over 65 years Correlation Summary
| Measurement | Bahamian | Immigrants from Germany |
| Minimum | $24,158 | $15,625 |
| Maximum | $93,779 | $115,357 |
| Range | $69,621 | $99,732 |
| Mean | $49,773 | $62,831 |
| Median | $48,251 | $62,572 |
| Interquartile 25% (IQ1) | $39,444 | $45,444 |
| Interquartile 75% (IQ3) | $55,975 | $74,989 |
| Interquartile Range (IQR) | $16,531 | $29,545 |
| Standard Deviation (Sample) | $14,935 | $23,868 |
| Standard Deviation (Population) | $14,804 | $23,438 |
Similar Demographics by Householder Income Over 65 years
Demographics Similar to Bahamians by Householder Income Over 65 years
In terms of householder income over 65 years, the demographic groups most similar to Bahamians are Hopi ($50,925, a difference of 0.15%), Kiowa ($51,140, a difference of 0.28%), Immigrants from Haiti ($51,219, a difference of 0.43%), Black/African American ($50,779, a difference of 0.44%), and Immigrants from Grenada ($50,747, a difference of 0.50%).
| Demographics | Rating | Rank | Householder Income Over 65 years |
| Colville | 0.0 /100 | #320 | Tragic $51,739 |
| Menominee | 0.0 /100 | #321 | Tragic $51,719 |
| British West Indians | 0.0 /100 | #322 | Tragic $51,463 |
| Cajuns | 0.0 /100 | #323 | Tragic $51,397 |
| Immigrants | Congo | 0.0 /100 | #324 | Tragic $51,393 |
| Immigrants | Haiti | 0.0 /100 | #325 | Tragic $51,219 |
| Kiowa | 0.0 /100 | #326 | Tragic $51,140 |
| Bahamians | 0.0 /100 | #327 | Tragic $51,000 |
| Hopi | 0.0 /100 | #328 | Tragic $50,925 |
| Blacks/African Americans | 0.0 /100 | #329 | Tragic $50,779 |
| Immigrants | Grenada | 0.0 /100 | #330 | Tragic $50,747 |
| Pima | 0.0 /100 | #331 | Tragic $50,539 |
| Dutch West Indians | 0.0 /100 | #332 | Tragic $50,475 |
| Cape Verdeans | 0.0 /100 | #333 | Tragic $50,077 |
| Immigrants | Dominica | 0.0 /100 | #334 | Tragic $50,071 |
Demographics Similar to Immigrants from Germany by Householder Income Over 65 years
In terms of householder income over 65 years, the demographic groups most similar to Immigrants from Germany are Immigrants from Northern Africa ($62,522, a difference of 0.040%), Immigrants from Western Asia ($62,645, a difference of 0.16%), Basque ($62,653, a difference of 0.17%), Immigrants from Eastern Europe ($62,693, a difference of 0.24%), and Aleut ($62,708, a difference of 0.26%).
| Demographics | Rating | Rank | Householder Income Over 65 years |
| Soviet Union | 87.8 /100 | #125 | Excellent $62,848 |
| Peruvians | 86.8 /100 | #126 | Excellent $62,766 |
| Swedes | 86.4 /100 | #127 | Excellent $62,736 |
| Aleuts | 86.1 /100 | #128 | Excellent $62,708 |
| Immigrants | Eastern Europe | 85.9 /100 | #129 | Excellent $62,693 |
| Basques | 85.4 /100 | #130 | Excellent $62,653 |
| Immigrants | Western Asia | 85.3 /100 | #131 | Excellent $62,645 |
| Immigrants | Germany | 83.9 /100 | #132 | Excellent $62,544 |
| Immigrants | Northern Africa | 83.6 /100 | #133 | Excellent $62,522 |
| Immigrants | Brazil | 81.2 /100 | #134 | Excellent $62,364 |
| Immigrants | Chile | 81.0 /100 | #135 | Excellent $62,354 |
| Alaskan Athabascans | 80.6 /100 | #136 | Excellent $62,330 |
| Immigrants | Syria | 80.2 /100 | #137 | Excellent $62,303 |
| Immigrants | Kazakhstan | 80.0 /100 | #138 | Excellent $62,292 |
| Lebanese | 79.9 /100 | #139 | Good $62,287 |