Bahamian vs Creek Median Family Income
COMPARE
Bahamian
Creek
Median Family Income
Median Family Income Comparison
Bahamians
Creek
$82,631
MEDIAN FAMILY INCOME
0.0/ 100
METRIC RATING
323rd/ 347
METRIC RANK
$82,560
MEDIAN FAMILY INCOME
0.0/ 100
METRIC RATING
324th/ 347
METRIC RANK
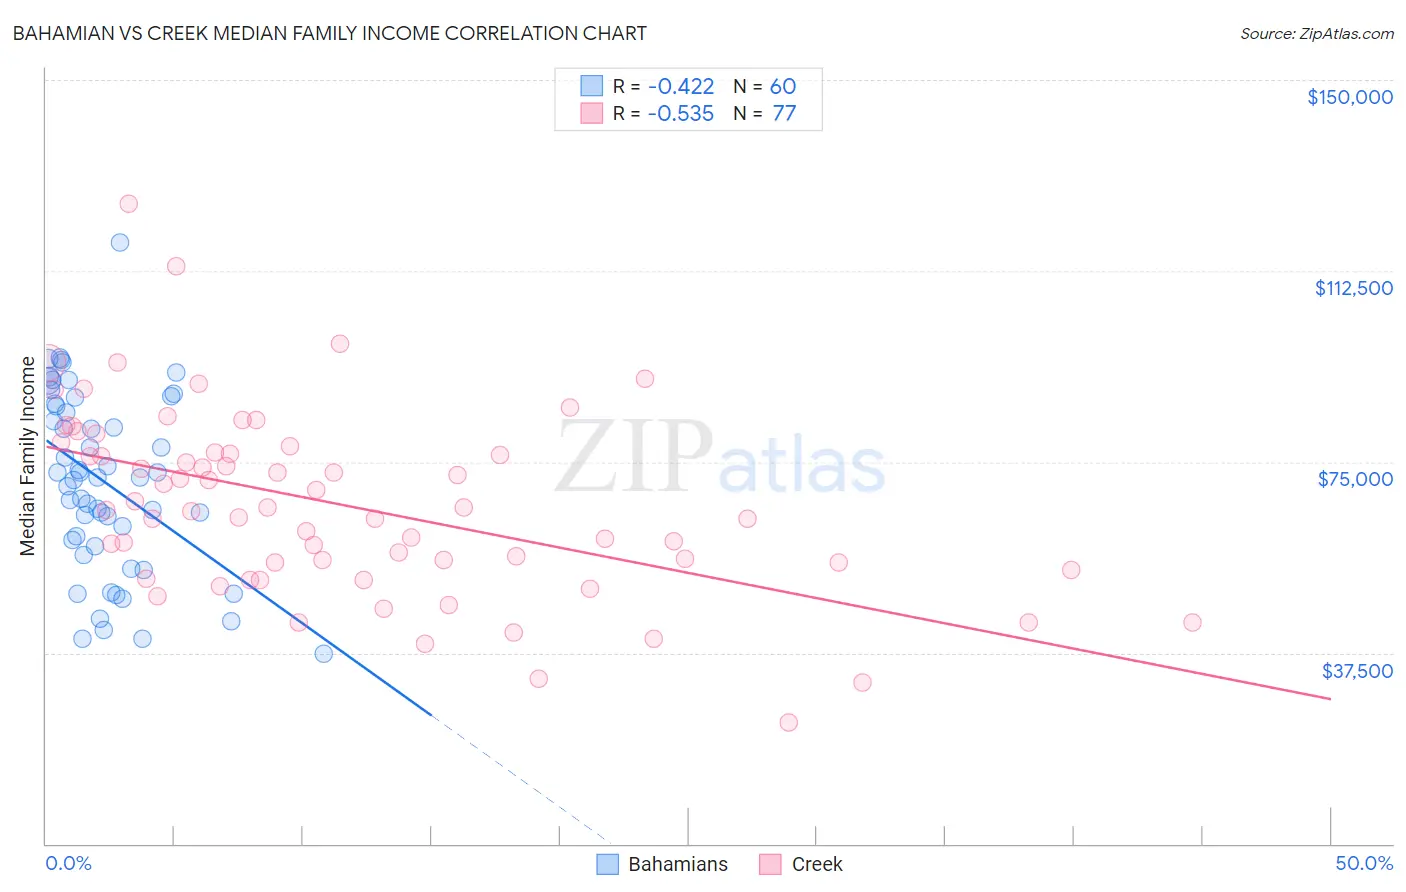
Bahamian vs Creek Median Family Income Correlation Chart
The statistical analysis conducted on geographies consisting of 112,596,489 people shows a moderate negative correlation between the proportion of Bahamians and median family income in the United States with a correlation coefficient (R) of -0.422 and weighted average of $82,631. Similarly, the statistical analysis conducted on geographies consisting of 178,420,625 people shows a substantial negative correlation between the proportion of Creek and median family income in the United States with a correlation coefficient (R) of -0.535 and weighted average of $82,560, a difference of 0.090%.
Median Family Income Correlation Summary
| Measurement | Bahamian | Creek |
| Minimum | $37,231 | $23,750 |
| Maximum | $118,067 | $125,671 |
| Range | $80,836 | $101,921 |
| Mean | $71,118 | $66,532 |
| Median | $71,812 | $65,440 |
| Interquartile 25% (IQ1) | $59,044 | $54,458 |
| Interquartile 75% (IQ3) | $86,176 | $77,450 |
| Interquartile Range (IQR) | $27,132 | $22,992 |
| Standard Deviation (Sample) | $17,647 | $18,322 |
| Standard Deviation (Population) | $17,499 | $18,202 |
Demographics Similar to Bahamians and Creek by Median Family Income
In terms of median family income, the demographic groups most similar to Bahamians are Sioux ($82,386, a difference of 0.30%), Dominican ($82,888, a difference of 0.31%), Immigrants from Congo ($82,216, a difference of 0.51%), Arapaho ($82,064, a difference of 0.69%), and Immigrants from Caribbean ($83,319, a difference of 0.83%). Similarly, the demographic groups most similar to Creek are Sioux ($82,386, a difference of 0.21%), Dominican ($82,888, a difference of 0.40%), Immigrants from Congo ($82,216, a difference of 0.42%), Arapaho ($82,064, a difference of 0.61%), and Black/African American ($81,912, a difference of 0.79%).
| Demographics | Rating | Rank | Median Family Income |
| Choctaw | 0.0 /100 | #313 | Tragic $84,835 |
| Immigrants | Bahamas | 0.0 /100 | #314 | Tragic $84,732 |
| Apache | 0.0 /100 | #315 | Tragic $84,451 |
| Immigrants | Haiti | 0.0 /100 | #316 | Tragic $84,018 |
| Yakama | 0.0 /100 | #317 | Tragic $83,932 |
| Immigrants | Mexico | 0.0 /100 | #318 | Tragic $83,639 |
| Immigrants | Honduras | 0.0 /100 | #319 | Tragic $83,618 |
| Seminole | 0.0 /100 | #320 | Tragic $83,354 |
| Immigrants | Caribbean | 0.0 /100 | #321 | Tragic $83,319 |
| Dominicans | 0.0 /100 | #322 | Tragic $82,888 |
| Bahamians | 0.0 /100 | #323 | Tragic $82,631 |
| Creek | 0.0 /100 | #324 | Tragic $82,560 |
| Sioux | 0.0 /100 | #325 | Tragic $82,386 |
| Immigrants | Congo | 0.0 /100 | #326 | Tragic $82,216 |
| Arapaho | 0.0 /100 | #327 | Tragic $82,064 |
| Blacks/African Americans | 0.0 /100 | #328 | Tragic $81,912 |
| Dutch West Indians | 0.0 /100 | #329 | Tragic $81,852 |
| Cheyenne | 0.0 /100 | #330 | Tragic $81,385 |
| Immigrants | Dominican Republic | 0.0 /100 | #331 | Tragic $81,233 |
| Natives/Alaskans | 0.0 /100 | #332 | Tragic $80,908 |
| Kiowa | 0.0 /100 | #333 | Tragic $80,885 |