Bahamian vs Kiowa Median Family Income
COMPARE
Bahamian
Kiowa
Median Family Income
Median Family Income Comparison
Bahamians
Kiowa
$82,631
MEDIAN FAMILY INCOME
0.0/ 100
METRIC RATING
323rd/ 347
METRIC RANK
$80,885
MEDIAN FAMILY INCOME
0.0/ 100
METRIC RATING
333rd/ 347
METRIC RANK
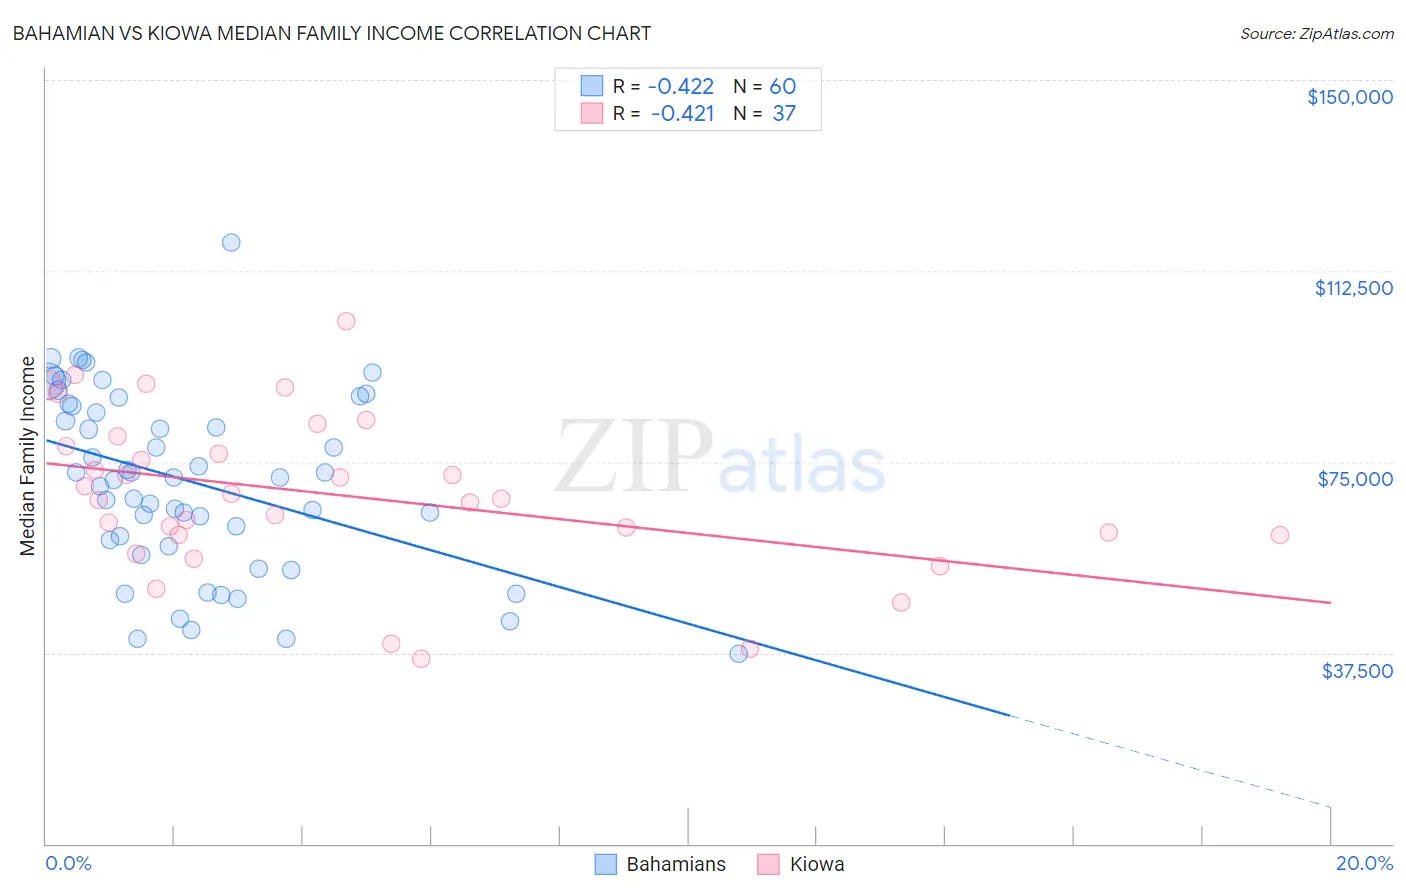
Bahamian vs Kiowa Median Family Income Correlation Chart
The statistical analysis conducted on geographies consisting of 112,596,489 people shows a moderate negative correlation between the proportion of Bahamians and median family income in the United States with a correlation coefficient (R) of -0.422 and weighted average of $82,631. Similarly, the statistical analysis conducted on geographies consisting of 56,095,481 people shows a moderate negative correlation between the proportion of Kiowa and median family income in the United States with a correlation coefficient (R) of -0.421 and weighted average of $80,885, a difference of 2.2%.
Median Family Income Correlation Summary
| Measurement | Bahamian | Kiowa |
| Minimum | $37,231 | $36,250 |
| Maximum | $118,067 | $102,708 |
| Range | $80,836 | $66,458 |
| Mean | $71,118 | $68,555 |
| Median | $71,812 | $67,750 |
| Interquartile 25% (IQ1) | $59,044 | $60,573 |
| Interquartile 75% (IQ3) | $86,176 | $79,021 |
| Interquartile Range (IQR) | $27,132 | $18,448 |
| Standard Deviation (Sample) | $17,647 | $15,572 |
| Standard Deviation (Population) | $17,499 | $15,360 |
Demographics Similar to Bahamians and Kiowa by Median Family Income
In terms of median family income, the demographic groups most similar to Bahamians are Creek ($82,560, a difference of 0.090%), Sioux ($82,386, a difference of 0.30%), Dominican ($82,888, a difference of 0.31%), Immigrants from Congo ($82,216, a difference of 0.51%), and Arapaho ($82,064, a difference of 0.69%). Similarly, the demographic groups most similar to Kiowa are Native/Alaskan ($80,908, a difference of 0.030%), Immigrants from Dominican Republic ($81,233, a difference of 0.43%), Cheyenne ($81,385, a difference of 0.62%), Dutch West Indian ($81,852, a difference of 1.2%), and Black/African American ($81,912, a difference of 1.3%).
| Demographics | Rating | Rank | Median Family Income |
| Immigrants | Mexico | 0.0 /100 | #318 | Tragic $83,639 |
| Immigrants | Honduras | 0.0 /100 | #319 | Tragic $83,618 |
| Seminole | 0.0 /100 | #320 | Tragic $83,354 |
| Immigrants | Caribbean | 0.0 /100 | #321 | Tragic $83,319 |
| Dominicans | 0.0 /100 | #322 | Tragic $82,888 |
| Bahamians | 0.0 /100 | #323 | Tragic $82,631 |
| Creek | 0.0 /100 | #324 | Tragic $82,560 |
| Sioux | 0.0 /100 | #325 | Tragic $82,386 |
| Immigrants | Congo | 0.0 /100 | #326 | Tragic $82,216 |
| Arapaho | 0.0 /100 | #327 | Tragic $82,064 |
| Blacks/African Americans | 0.0 /100 | #328 | Tragic $81,912 |
| Dutch West Indians | 0.0 /100 | #329 | Tragic $81,852 |
| Cheyenne | 0.0 /100 | #330 | Tragic $81,385 |
| Immigrants | Dominican Republic | 0.0 /100 | #331 | Tragic $81,233 |
| Natives/Alaskans | 0.0 /100 | #332 | Tragic $80,908 |
| Kiowa | 0.0 /100 | #333 | Tragic $80,885 |
| Menominee | 0.0 /100 | #334 | Tragic $79,563 |
| Yup'ik | 0.0 /100 | #335 | Tragic $79,290 |
| Immigrants | Cuba | 0.0 /100 | #336 | Tragic $78,249 |
| Yuman | 0.0 /100 | #337 | Tragic $78,055 |
| Immigrants | Yemen | 0.0 /100 | #338 | Tragic $77,457 |